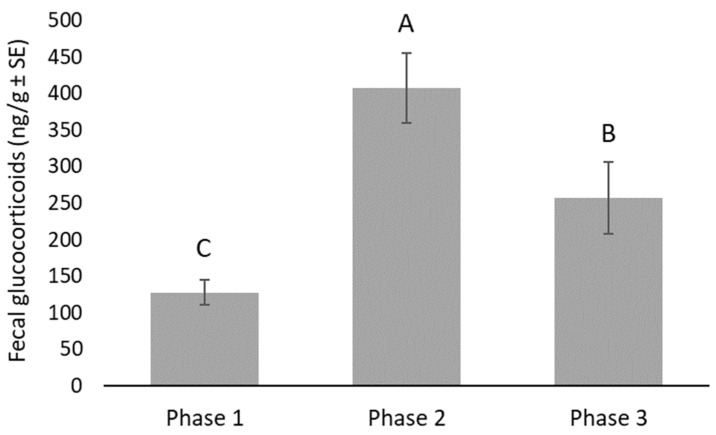
Figure 1.
Fecal glucocorticoid concentrations (ng/g) were significantly different across the three phases of husbandry (F16,86 = 14.17, p < 0.0001). Pairwise differences were all declared significant at p < 0.05. Columns with different labels (A, B and C) are significantly different from one another.

