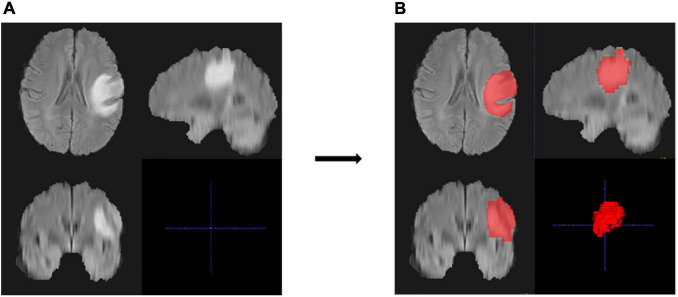
FIGURE 2.
An example of region of interest (ROI) and the segmentation results of the MRI images of one patient. (A,B) Cross-section views of images before segmentation (A) and after manual segmentation (B). The lesion in the original image was high and showed a bright signal (A), and the ROI of the lesion area is represented as red after segmentation (B).

