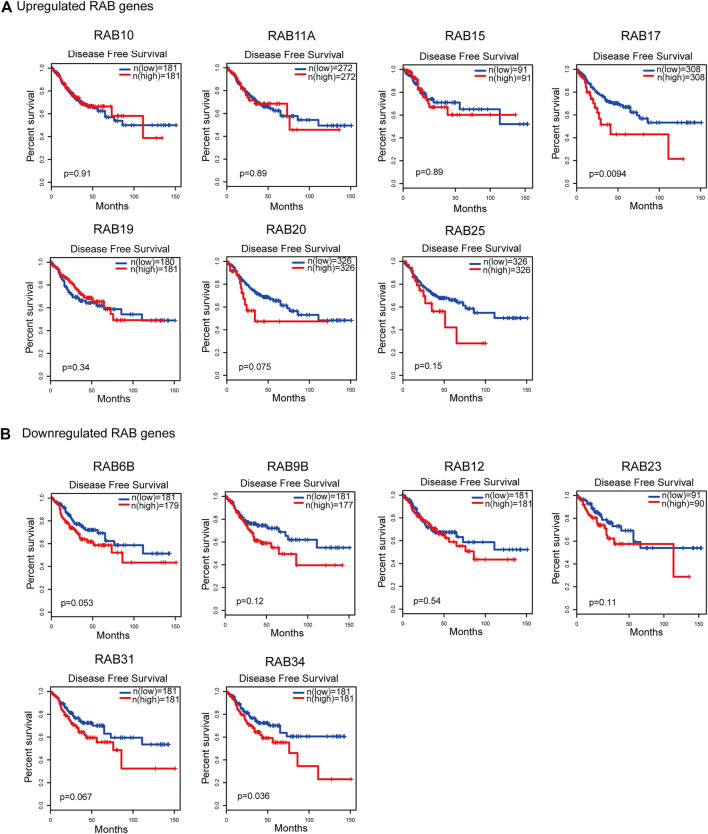
FIGURE 6.
Kaplan–Meier plots for the disease-free survival of CRC patients stratified by the mRNA expression level of RABs. (A) The disease-free survival curves of the upregulated-RABs (RAB10, RAB11A, RAB15, RAB17, RAB19, RAB20, and RAB25). (B) The disease-free survival curves of the downregulated-RABs (RAB6B, RAB9B, RAB12, RAB23, RAB31, and RAB34).

