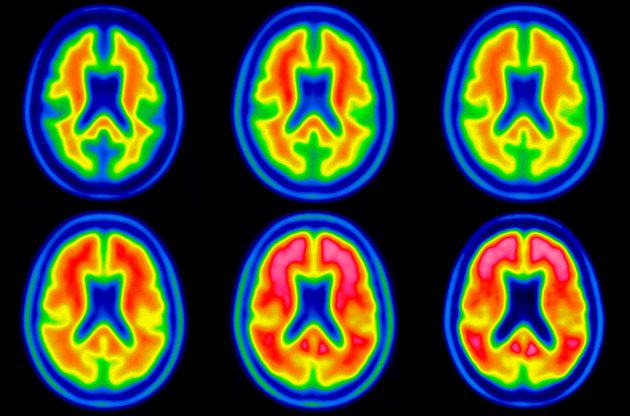
FIGURE 5.

Synthetic template images showing characteristic 18F-flutemetamol uptake pattern going from most negative case (upper left) to most positive case (lower right). Value of weight ranges from −1.0 (upper left) to 1.0 (lower right) and is increased by 0.4 going from left to right, top to bottom.
