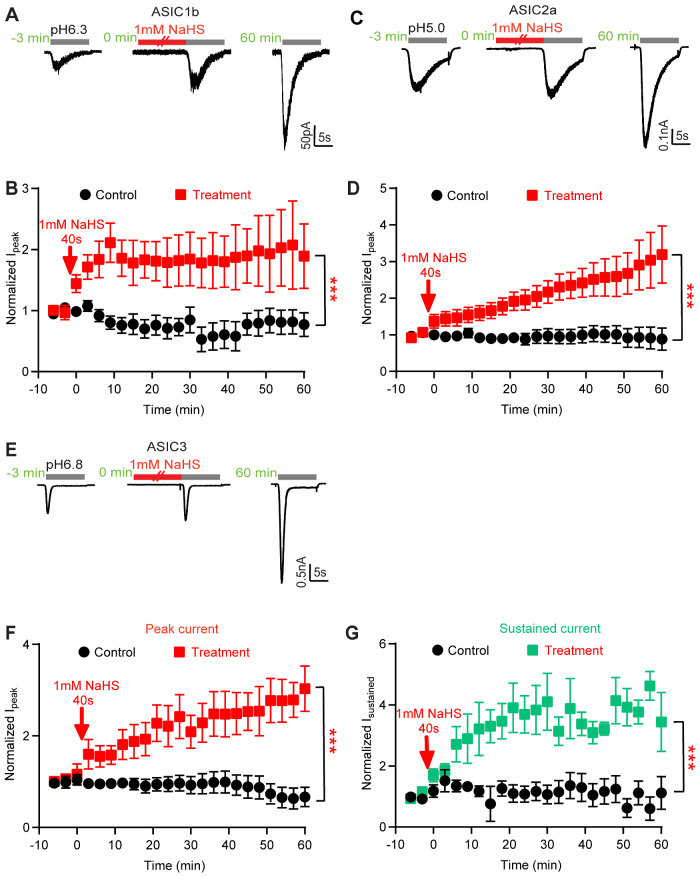
Figure 2.
NaHS Potentiates the Current of All Tested ASIC Isoforms. Current traces and data were obtained by whole-cell patch-clamp at −60 mV of CHO cells transfected with the indicated ASIC isoforms. The indicated time points are relative to the 40-s application of 1 mM NaHS. All quantified currents had been normalized to that induced by acid before the NaHS treatment (at −3 and −6 min). The statistical significance in (B), (D), (F), and (G) is based in each case on a comparison between treatment and control over the period 0–60 min by one-way ANOVA test and Dunnett’s post hoc test; ***P < 0.001. (A) Representative rat ASIC1b current traces, induced by acidification to pH 6.3 at different time points, as indicated. (B) Time course of pH 6.3-induced peak ASIC1b current amplitudes measured without (control, black symbols) or with a 40-s exposure to 1 mM NaHS as indicated (treatment, red symbols), n = 5. (C) Representative human ASIC2a current traces, induced by acidification to pH 5.0. (D) Time course of pH 5.0-induced ASIC2a peak current amplitudes measured without (control, black symbols) or with a 40-s exposure to 1mM NaHS as indicated (treatment, red symbols), n = 5–6. (E) Representative rat ASIC3 current traces, induced by acidification to pH 6.8 at different time points, as indicated. (F) Time course of pH 6.8-induced ASIC3 peak current amplitudes measured without (black symbols) or with a 40-s exposure to 1 mM NaHS as indicated (red symbols), n = 5–6. (G) Time course of pH 6.8-induced ASIC3 sustained current amplitudes measured without (black symbols) or with a 40-s exposure to 1 mM NaHS (green symbols) as indicated, n = 5–6.

