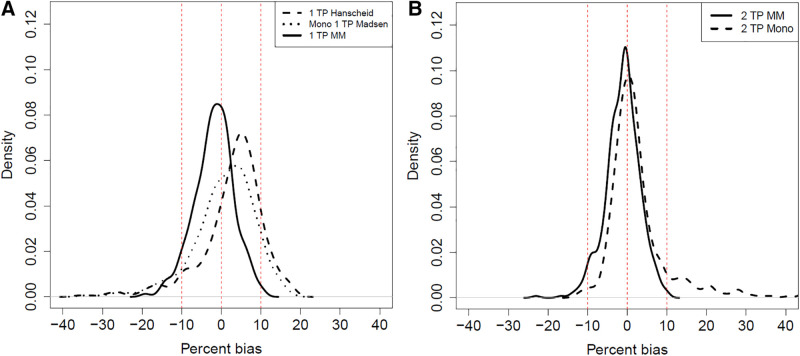
FIGURE 5.
Comparison of percentage bias in TIA for reduced-time-point (TP) methods in virtual cohort of 500 kidneys for 1-time-point methods (A) and 2-time-point methods (B). MM = mixed model. Mono refers to monoexponential fit. One kidney with 2-time-point monoexponential % bias > 1,000 not included in B for visualization purposes.

