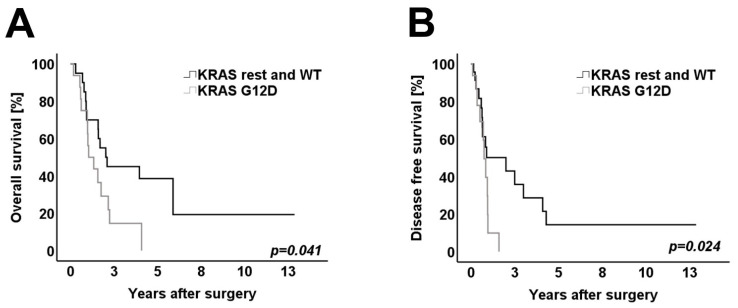
Figure 3.
Kaplan–Meier survival curves for: (A) Overall survival of patients with a KRAS G12D mutation and patients with other KRAS mutations and WT (n = 39). (B) Disease-free survival of patients with KRAS G12D mutation and patients with other KRAS mutation and WT (n = 39). Log-rank test was used to test for significance. p-value < 0.05 indicates significance. Patients with KRAS G12D mutations showed a significantly worse OS and DFS when compared to patients with all other KRAS mutations or WT.

