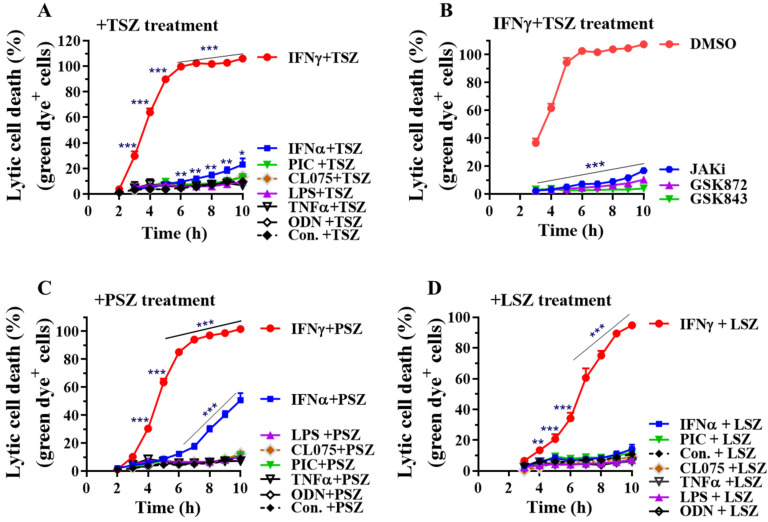
Figure 2.
IFNγ preferentially promotes AEC necroptosis by real-time lytic cell death analysis. Mouse primary AECs were incubated with control PBS (Con.), IFNα2 (50 ng/mL), IFNγ (50 ng/mL), TNFα (25 ng/mL), LPS (100 ng/mL), poly(I:C) (PIC, 0.5 μg/mL), CL075 (1 μg/mL) or ODN1585 (1 μM) for 24 h, then treated in a 0–10 h period with DMSO, or TNFα (15 ng/mL) plus 100 nM Smac mimetic AZD5582 and 25 µM z-VAD-FMK (A, +TSZ), poly(I:C) (0.2 µg/mL) plus 100 nM Smac mimetic and 40 µM z-VAD-FMK (C, +PSZ) or LPS (200 ng/mL) plus 100 nM Smac mimetic AZD5582 and 25 µM z-VAD-FMK (D, +LSZ) in the presence of an asymmetric cyanine dye. (B) Mouse AECs were incubated without or with IFNγ (50 ng/mL) in the presence of DMSO or JAK kinase inhibitor-1 (JAKi, 1 μM) for 24 h, washed and then subjected to TSZ-induced real-time necroptosis assay as described above in the presence of DMSO, GSK872 (5 μM), GSK843 (2 μM) or JAKi (1 μM). The percentage of lytic cell death (green dye+ cells) was calculated by comparison to the maximal fluorescence induced by a lysis buffer in each group and presented as mean ± SE. In panel (A): Con.+TSZ, n = 16; IFNγ+TSZ, n = 15; IFNα+TSZ, n = 11; other treatments, n = 4–6. In panel (B): DMSO, n = 10; others, n = 5–7. In panel (C): Con.+PSZ, n = 15; IFNγ+PSZ, n = 14; IFNα+PSZ, n = 10; other treatments, n = 4–5. In panel (D): Con.+LSZ, n = 8; IFNγ or IFNα+LSZ, n = 6; other treatments, n = 4–5. Two-way ANOVA and unpaired Student’s t test were performed in (A–D). * p < 0.05; ** p < 0.01; *** p < 0.001 versus control (Con.) or DMSO in each group. The orders of each agonist-induced percentage of lytic cell death were listed on the right in panels (A,C,D).

