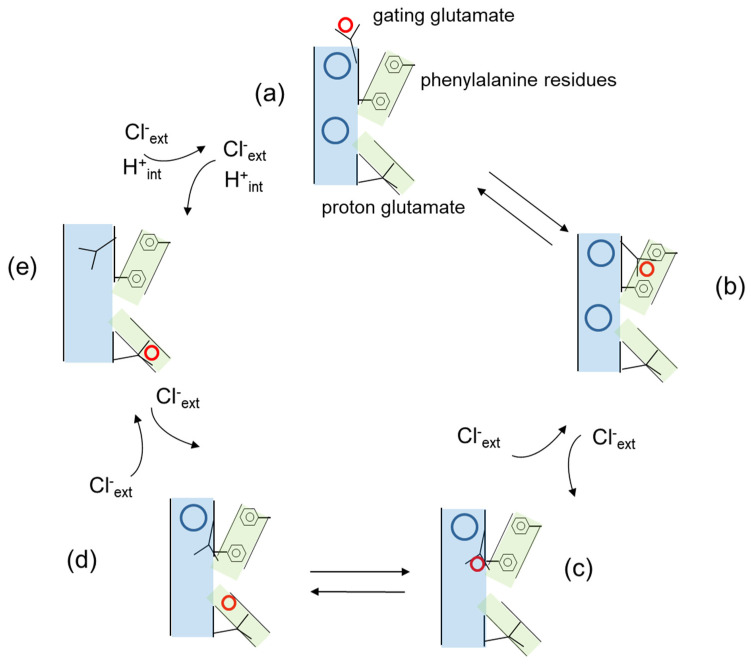
Figure 2.
Simplified model of the transport cycle of CLC transporters based on the work of Leisle et al. [27]. Cl− ions at the external and central binding sites are represented as blue circles, H+ are represented as red circles, the anion permeation pathway is shown in pale blue, the H+ permeation pathway in green. The gating and proton glutamates and the phenyalanine residues are explicitly indicated in the figure. (a) The gating glutamate is oriented towards the extracellular space and its side chain protonated. Cl− ions are present at both the external and central binding site. (b) The protonated gating glutamate rotates towards the interior of the protein along a pathway defined by two phenylalanine residues. (c) The protonated gating glutamate continues its movement towards the central binding site displacing a Cl− ion towards the extracellular space. (d) The H+ dissociates from the side chain of the gating glutamate. (e) The H+ binds the proton glutamate and the side chain of the gating glutamate moves upwards to occupy the external anion binding site displacing a second Cl− ion. Not explicitly indicated is an intermediate state following proton release to the cytosolic side in which Cl− ions from the internal side have access to the permeation pathway.

