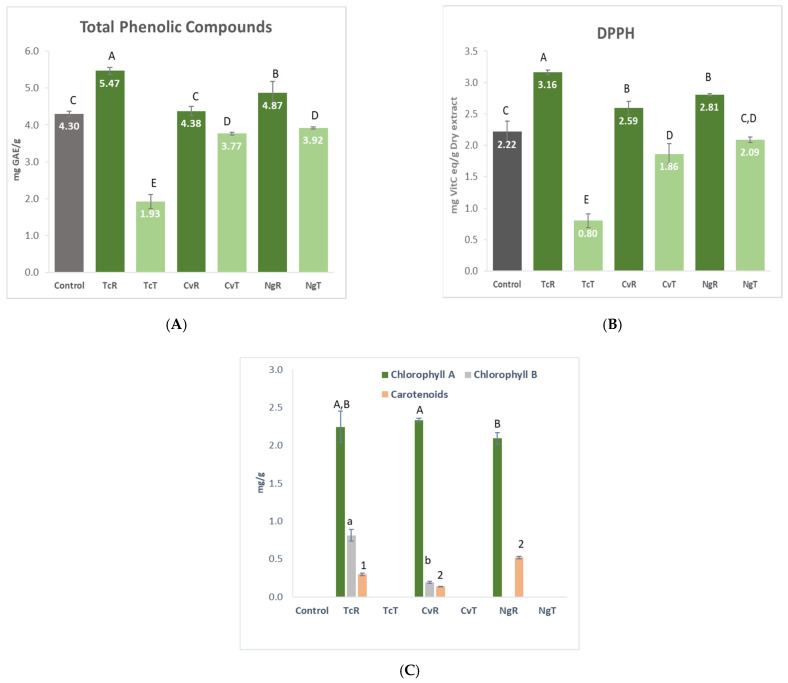
Figure 5.
Measurement of the antioxidant capacity using total phenols (A), DPPH (B), and pigments (C) in the given gluten-free breads enriched with Tetraselmis chuii (TcR), Tetraselmis chuii ethanol-treated (TcT), Chlorella vulgaris (CvR), Chlorella vulgaris ethanol-treated (CvT), Nannochloropsis gaditana (NgR) and Nannochloropsis gaditana ethanol-treated (NgT). Totality dark refers to control (A,B). Values represent mean ± stdev (n = 3). Different letters for a given parameter indicate a significant difference (p > 0.05) using a Fisher LSD test. Significant differences in chlorophyll a, chlorophyll b, and carotenoids are shown by capital letters, small letters, and numbers, respectively.

