Figure 4.
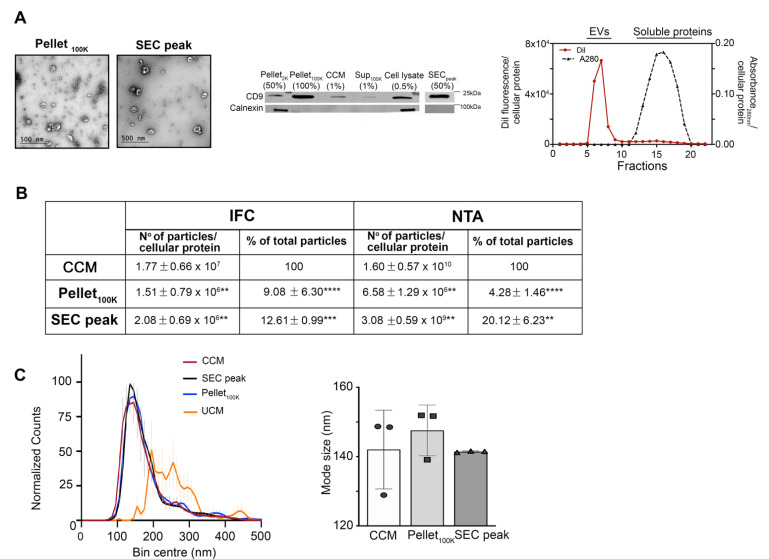
Characterization of EVs separated by sequential ultracentrifugation or ultrafiltration size-exclusion chromatography. EVs were separated by UC and SEC as indicated in Figure 1. (A) Electron micrographs of Pellet100K and SECpeak fractions show characteristic cup-shaped EV particles. The immunoblot shows the presence of the EV marker CD9 and the absence of calnexin in all fractions obtained from the conditioned medium after the initial centrifugation at 2000× g, indicating the fractions are not contaminated by apoptotic bodies or cell debris. Numbers in parenthesis indicate the fraction for each sample that was loaded in the gel. A representative chromatogram of EV separation by SEC is shown on the right. (B) Summary of the average number of particles present in each fraction (normalized for cellular protein content) and percentage relative to the total number of particles detected in the cleared conditioned medium (CCM). Particle numbers were determined by imaging flow cytometry (IFC) and nanoparticle tracking analysis (NTA). Values are means ± SD of 6 (IFC) or 3 (NTA) independent experiments. The paired t-test was applied to compare the Pellet100K or the SEC peak to the cleared conditioned medium using GraphPad Prism **** p < 0.0001, *** p < 0.001, ** p < 0.01 (C) Particle size distribution profiles of EVs in the cleared conditioned medium (CCM, circles) and after isolation by UC (Pellet100K, squares) or SEC (SEC peak, triangles), as detected by NTA. Each profile was obtained using the mean values from three experiments. Vertical lines are SD for each size bin. The graph on the right shows the mode size for each indicated fraction. Particle size is not significantly different among fractions. Data are mean values ± SD of three independent experiments. CCM = cleared conditioned medium, UCM = unconditioned medium.

