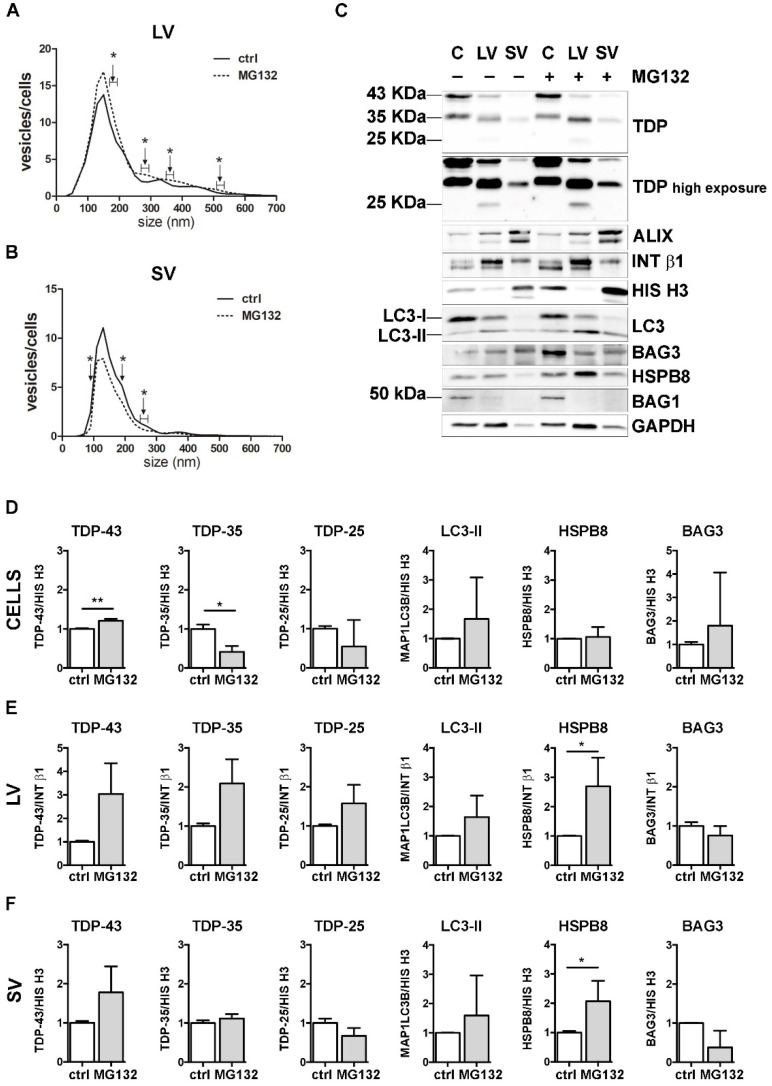
Figure 3.
The effect of UPS inhibition on the EVs number and protein content. (A,B) NTA distribution of LVs (A) and SVs (B) isolated from NSC-34 cells treated overnight (o/n, 16 h) with MG132 (10 μM). The graphs represent the mean of n = 3 biological replicates; x-axis = vesicles dimension, expressed in nm; y-axis = vesicles concentration, expressed as ratio between the number of vesicles and the number of secreting cells. The data show that MG132 treatment statistically increased the secretion of 170–190, 270–290, 350–370, 510–530 and 710–730 nm large vesicles (A), whereas it statistically reduced the secretion of 90, 190 and 250–270 nm small vesicles (B) (* p < 0.05, Welch’s t-test). (C–F) WB analysis (C) and relative quantifications (D–F) of total RIPA-extracted proteins from NSC-34 cells, LVs and SVs, untreated or treated o/n with MG132. TDP-43 species, EVs markers and some PQC system members of interest (MAP1LC3B-II, BAG3, HSPB8, BAG1) have been analyzed. Bar graphs represent the mean optical density ± SD of a specific protein normalized on the optical density of the internal housekeeping protein (HIS H3 for cells and SVs; INT β1 for LVs) and reported in comparison to the corresponding untreated sample (ctrl) of three biological replicates (* p < 0.05, ** p < 0.01, unpaired one-tailed t-test).

