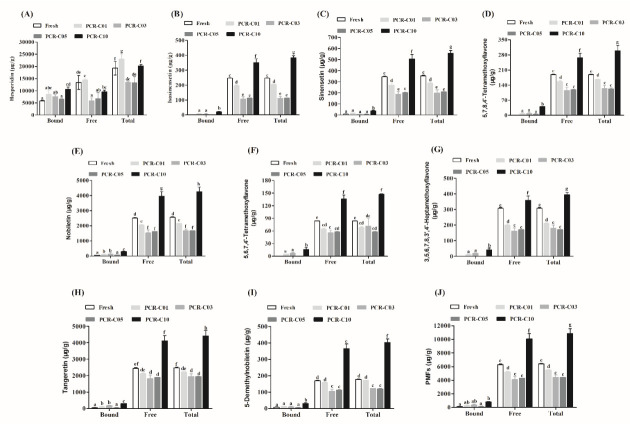
Figure 2.
The variation of nine free, bound, and total flavonoids in PCR-C samples at different storage periods. (A) hesperidin, (B) isosinensetin, (C) sinensetin, (D) 5,7,8,4′-tetramethoxyflavone, (E) nobiletin, (F) 5,6,7,4′-tetramethoxyflavone, (G) 3,5,6,7,8,3′,4′-heptamethoxyflavone, (H) tangeretin, (I) 5-demethylnobiletin, (J) PMFs. Data were expressed as the mean ± SD (n = 3). Mean values with different letters in the figure indicate significant differences among PCR-C of different storage periods (p < 0.05).

