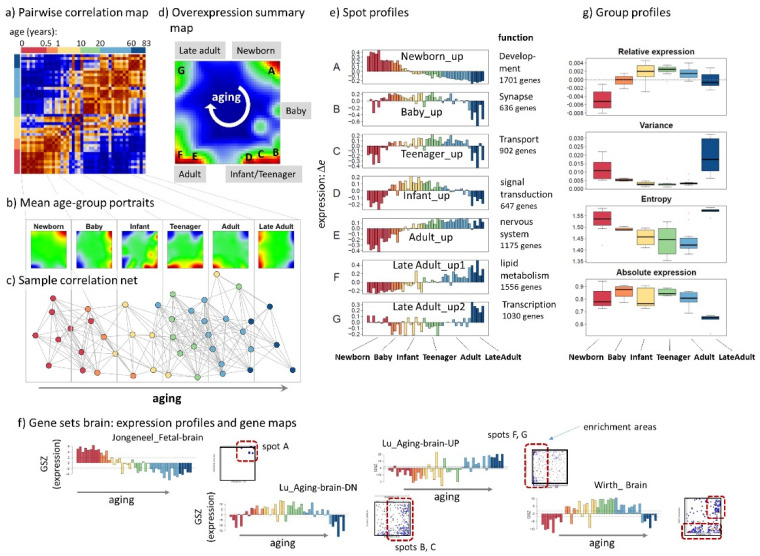
Figure 2.
Gene expression characteristics of the developing and aging brain: (a) The pairwise correlation map (PCM) of samples’ SOM portraits indicates continuous alterations of the brain transcriptome upon aging in terms of a “stripe” of mutually correlated samples along the diagonal. (b) Mean SOM portraits of different age strata reveal distinct spot patterns of activated genes. (c) The sample similarity net reflects a virtually one-dimensional development of the brain from the left to the right. (d) The overexpression summary map indicates seven spots (“A”–“G”) of co-expressed genes. Upon aging spots activate in a clockwise direction as indicated by the arrow. (e) The spot profiles reveal specific over- and under-expression in different age intervals. Δe is the differential log-expression with respect to the mean expression of each gene averaged over all samples (see Table A1). (f) Expression profiles of gene sets of brain aging are supported by our age courses of the brain transcriptome. Gene sets were taken from [26,33,34]. (g) Boxplots of different expression measures as a function of the age-strata indicate a transition between developmental and aging regimes in juveniles (infant, teenager) evident as an “hourglass”-like shape of relative expression, variance, and entropy along the age axis.

