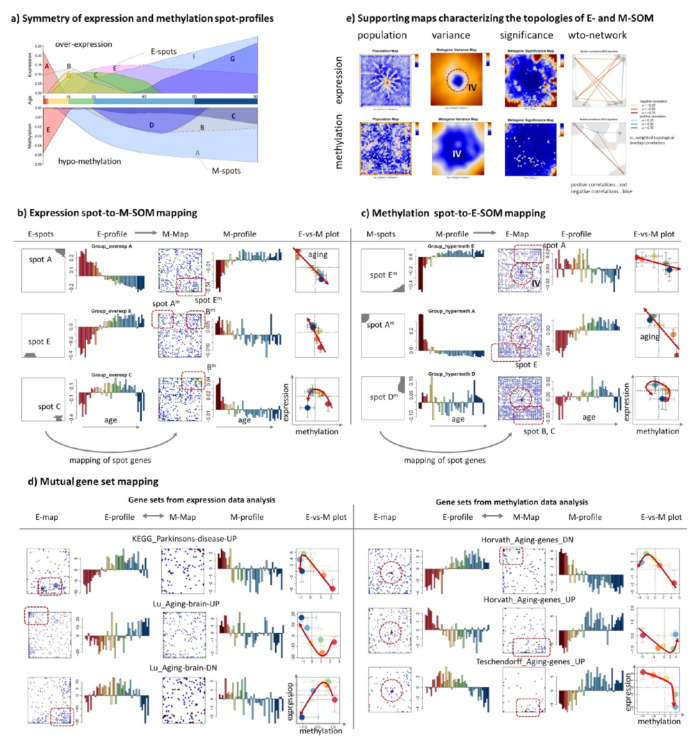
Figure 4.
Couplings between expression and methylation upon development and aging. (a) Spot profiles of expression and methylation suggest antagonistic changes. Only overexpression (Δe > 0) and hypomethylation (Δm < 0) parts of the curves are shown. Mutual mapping of spot genes, (b) of E-spots into M-SOM and, (c) vice versa of M-spots into E-SOM reveal spot “melting” as indication of partial de-coupling between expression and methylation. The E- and M-profiles reveal antagonistic changes upon aging. (d) Mutual mapping of gene sets taken from previous expression (left part) and methylation (right part) studies. It reveals melting (increased disorder) upon mapping into the map not referring to the experimental origin of the data in similarity to results shown in part (b,c). The arrows in the correlation plots in part (b,d) point in direction of increasing age (the circles refer to mean values averaged over the age groups) and serve as guides for the eyes. (e) Supporting maps [26] visualize numbers of genes per metagene (population map), variance of metagene expression/methylation, their significance (p-values derived from t-statistics of metagene expression/methylation), and wto (weighted topological overlap) correlation coefficients between spots [42]. One finds a cluster of invariant genes (IV) in the middle of the E-SOM. The wto map reflects anticorrelated expression/methylation in opposite corners of the map.

