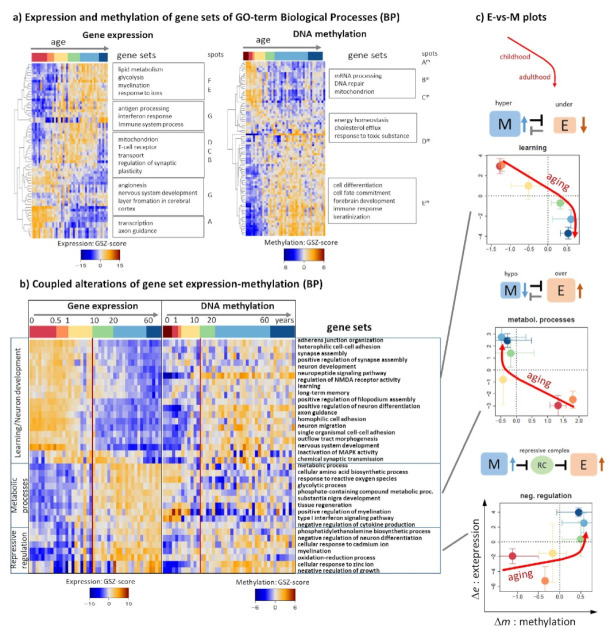
Figure 5.
Gene function, expression, and methylation: (a) Gene expression and DNA promoter methylation of gene sets of the GO-category biological function (BP) provide an overview of functional changes upon aging. Expression and methylation were addressed independently. (b) Joint gene set analysis of gene expression and methylation as a function of age. Affected functions roughly divide into three major categories as indicated at the left axis of the heatmap. (c) Expression (E) versus methylation (M) plots of the three categories. Dots are mean values over all gene sets per category. Arrows serve as a guide for the eye and illustrate alterations upon aging. Anti-correlated relations between M and E suggest mutual repression while positive correlation can be rationalized in terms of repressive complexes (RC) which mediate interactions between M and E.

