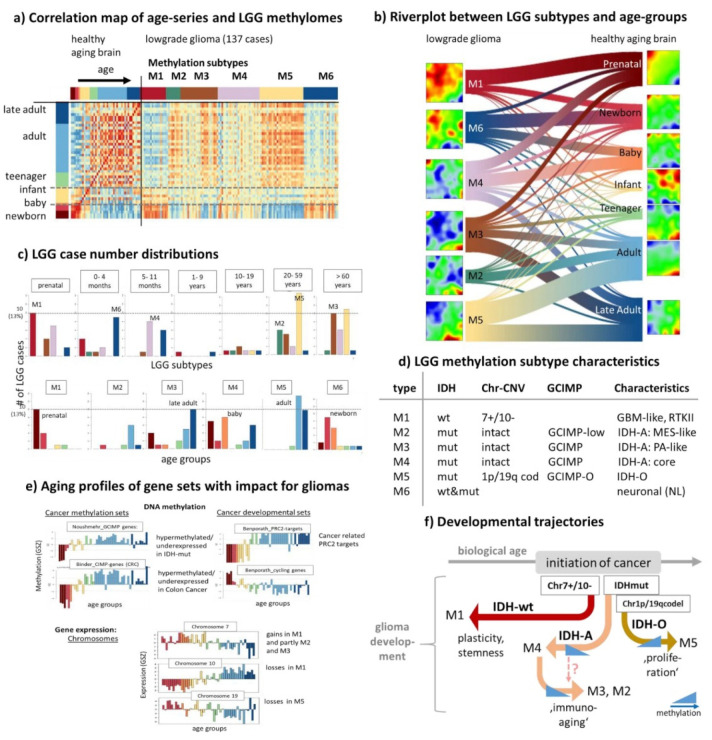
Figure 8.
Comparison of the aging methylomes of healthy brain and that of lower-grade glioma (LGG). (a) The pairwise correlation heatmap between the samples indicates a strong correlation between different LGG-methylation and aging groups (red), e.g., between M1 (IDH-wt group) and the prenatal brain. The LGG methylation data were trained together with the healthy brain methylomes using exSOM transfer learning [32]. (b) The river plot visualizes the distribution of LGG tumor methylomes of the different M-groups among the age groups. The SOM portraits of the LGG were obtained using exSOM method applied to the aging data. (c) Distribution of samples of the M-groups among the age groups (part above) and vice versa, of the age groups among the LGG-groups (part below). (d) Characteristics of the M(ethylation) subtypes regarding IDH mutation status, chromosomal aberrations (7+/10−: gains at chromosome 7 and losses at chromosome 10, 1p/19q cod: codeletion at chromosomes 1p and 19q), GCIMP type and characteristics (GBM: glioblastoma, MES: mesenchymal, PA: pilocytic astrozytoma, IDH-A: IDH mutated astrocytoma, IDH-O: IDH mutated oligodendroglioma). (e) Aging profiles of DNA methylation of genes hypermethylated in the GCIMP [81] and CIMP colon cancer [91], of PRC2 targets and cycling genes [92], and of the integral expression of genes at chromosomes 7, 10, and 19 (for further glioma related signatures see Figure A10). (f) Schematic summary: Cancer is initiated by genetic lesions usually in later adulthood (>45 years). Developmental trajectories point towards induction of stemness-like cancer cells (M1 and partly M4), subsequent immuno-aging (M2, M3), or metabo-aging (M5) which resemble different ages of the healthy brain. Development of the IDH-mut gliomas is shaped by altered DNA methylation.

