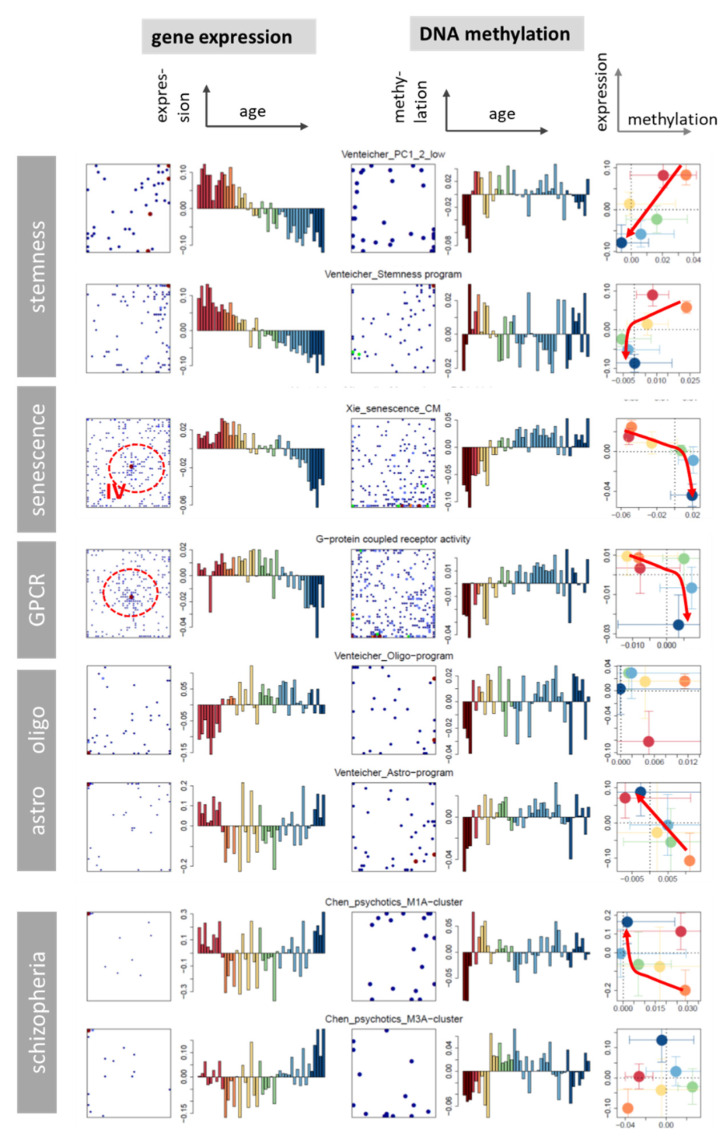
Figure A11.
Maps and profiles of brain-related gene sets taken from [93,94,119]. Stemness sets were taken from single cell transcriptomics [93]. They resemble courses of PRC2-repressed genes that govern stemness properties. Senescence genes were selected by hypermethylation criteria and virtually anticorrelate with expression [94]. Senescence genes and genes encoding GPCR accumulate in the IV-area of the expression map thus reflecting invariant gene expression upon aging. Single cell profiles of astrocytes and oligodendrocytes show mirror symmetric expression profiles with a minimum/maximum for children and adolescents. Both cell types seem to hypermethylate with age. Schizophrenia related sets taken from [119] resemble that of astrocytes.

