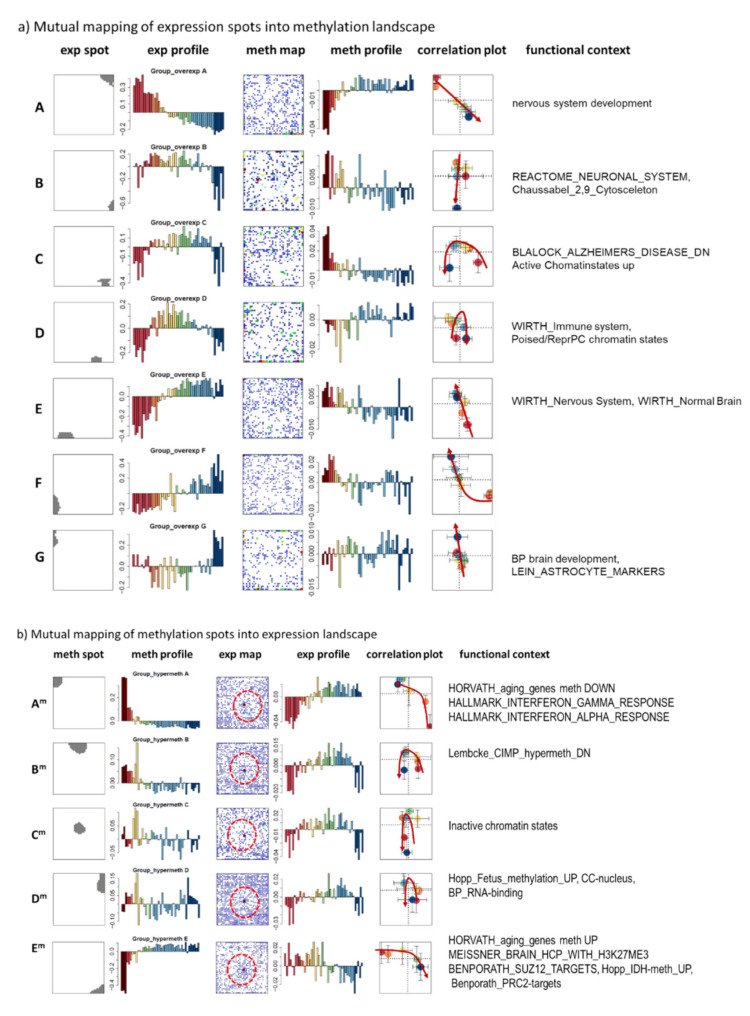
Figure A2.
Mutual mapping of genes of the expression spot modules into methylation SOM (part a) and vice versa, of genes of the methylation spot modules into expression SOM (part b). Spots virtually “melt” in both directions reflecting the lack of one-to-one relationships between co-expressed and co-methylated spot modules, meaning that expression of part of genes is not or weakly affected by methylation and vice versa. In expression space part of co-methylated genes show virtually invariant expression and accumulate in the middle of the expression map (red circles in part b; see also Figure 3e). The functional context was estimated by means of gene set enrichment analysis of a collection of about 6000 gene sets taken from literature and implemented in oposSOM [116] using a threshold of p < 10−5 (Fisher’s exact test for enrichment in the respective spot genes). Age groups are colored as assigned in the main paper. The correlation plots show means values over the respective age groups as circles.

