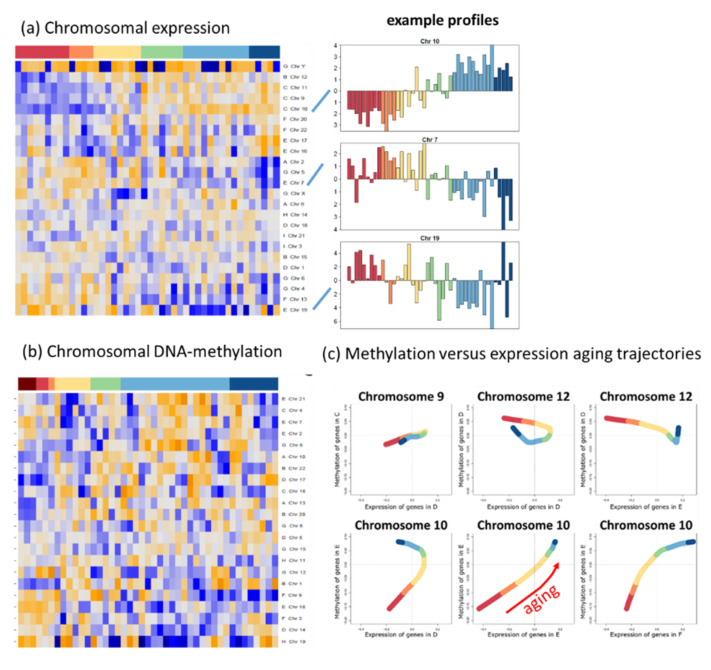
Figure A9.
Chromosomal gene expression and methylation: (a) Chromosomal expression partly show pronounced age courses, particularly of Chr. 10, Chr. 7 and Chr. 19. Aberrant copy numbers of these chromosomes govern gliomagenesis into different subtypes (see main text). (b) Changes in chromosomal DNA methylation are much less pronounced. (c) Methylation versus expression trajectories (see [118] for method) reveal turns into different directions at a “breakpoint” in the adolescent–early adult age range. The different trajectories of Chr. 10 refer to genes located in spots D, E and F. The show similar courses in childhood but different courses mainly due to different expression changes in adulthood.

