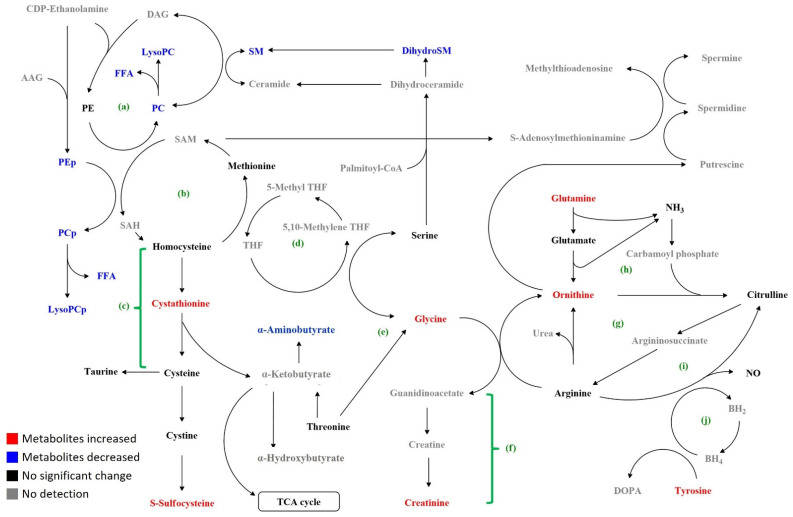
Figure 5.
Map of metabolic changes in PD compared to the controls. (a) Sphingolipid and related glycerophospholipid biosynthetic pathways; (b) methionine cycle; (c) transsulfuration pathway; (d) folate cycle; (e) glycine, serine, and threonine pathway; (f) creatine synthesis pathway; (g) urea cycle; (h) ornithine–proline–glutamate pathway; (i) nitric oxide (NO) synthesis pathway; (j) biopterin cycle. AAG: alkyl acylglycerol; BH4: tetrahydrobiopterin; BH2: dihydrobiopterin; DAG: diacylglycerol; dihydroSM: dihydrosphingomyelin; DOPA: dopamine; FAA: free fatty acid; LysoPC: lysophosphatidylcholine; PC: phosphatidylcholine; PCp: phosphatidylcholine-plasmalogen; PE: phosphatidylethanolamine; PEp: phosphatidylethanolamine-plasmalogen; SM: sphingomyelin; SAM: S-S-adenosyl methionine; SAH: S-adenosyl homocysteine; TCA: tricarboxylic acid.

