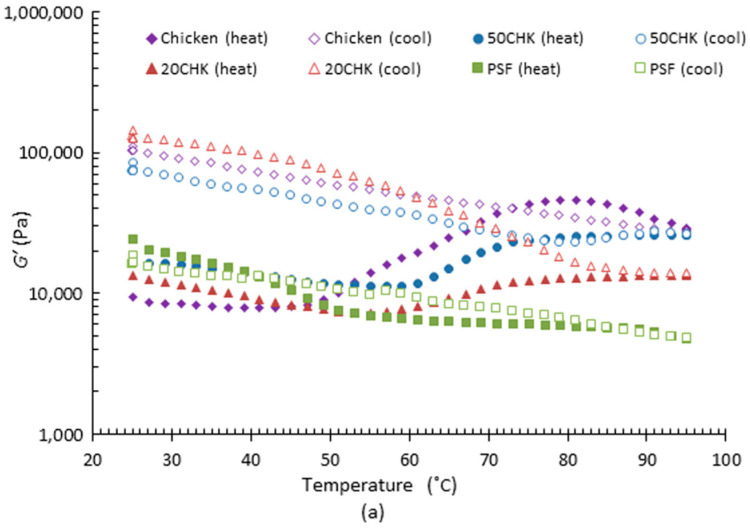
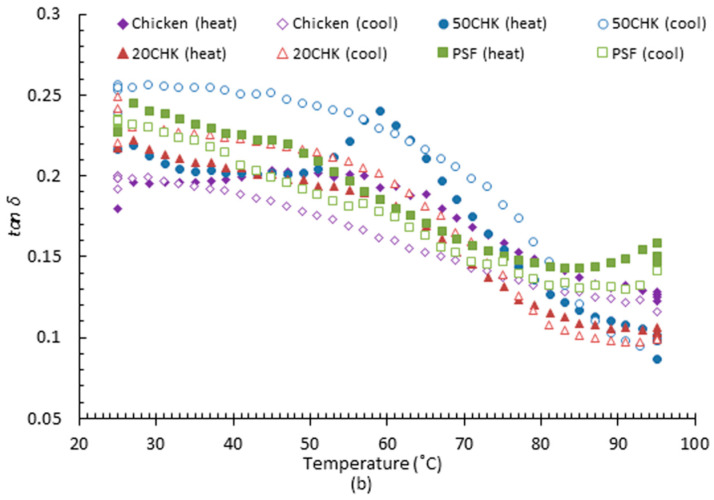
Figure 3.
Viscoelastic properties of PPI and chicken mixture samples during heating (25 to 95 °C) and cooling (95 to 25 °C). (a) Storage modulus (G’) and (b) tan δ. In the figure, PSF represents PPI paste containing both starch and fat; 20CHK represents 20% chicken added into PSF paste; 50CHK represents 50% chicken added into PSF pastes. The result shown was the mean value of triplicated tests.


