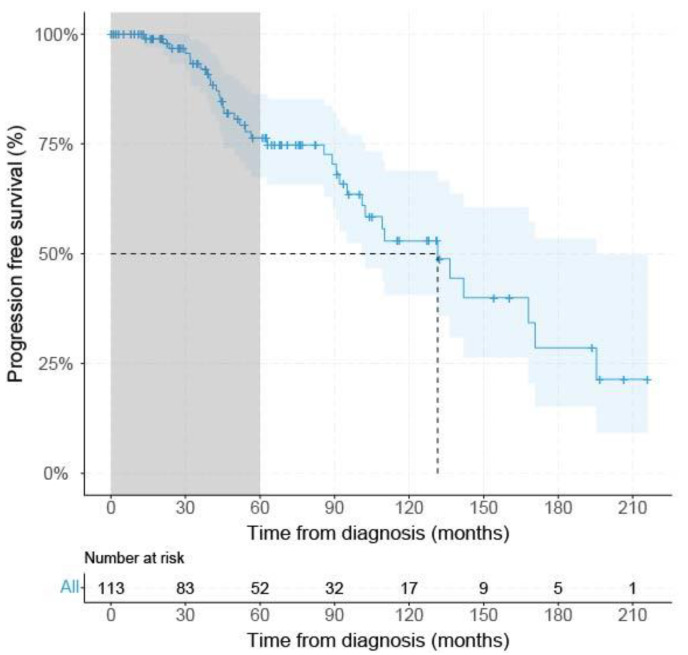
Figure 2.
Kaplan–Meier survival curve of all SF3B1mut UM. Grey area indicates PFS < 60 months. Dashed gray line indicates median progression free survival percentage with corresponding time from either diagnosis or treatment, dependent on the description in the original papers. Blue line shows progression-free survival with a confidence interval of 95% indicated by the blue area and censored data indicated by vertical bar.

