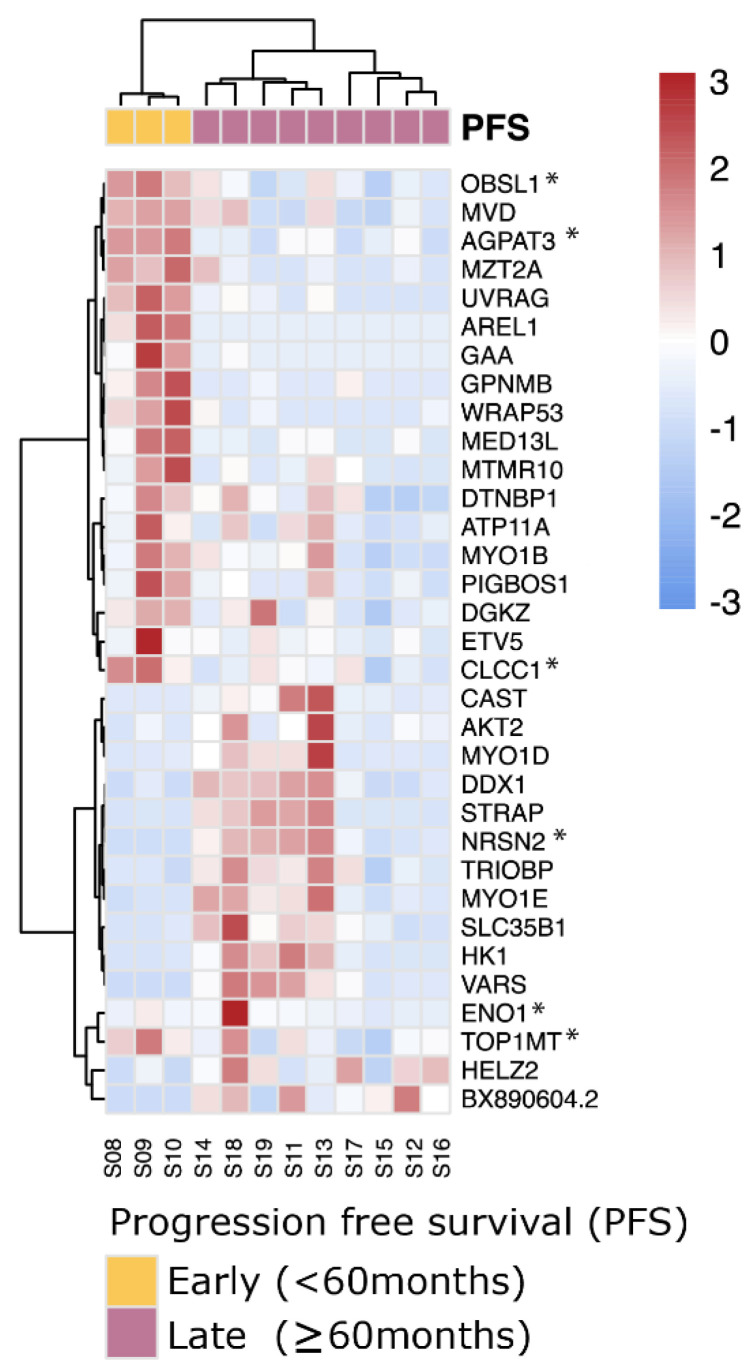
Figure 6.
SF3B1mut UM is characterized by aberrant splicing events. Unsupervised clustering (Euclidean distances and Ward.D2 method) on the differential exon usages between SF3B1mut samples in the ROMS cohort with PFS < 60 months and PFS ≥ 60 months. Values are mean-centered read counts represented with a z score of differentially expressed splicing events in genes (blue, low expression; red, high expression). Top bars represent PFS-status (yellow; PFS < 60 months and purple; PFS ≥ 60 months). Asterisk (*) indicates novel splicing aberrations that are either donors or acceptors.

