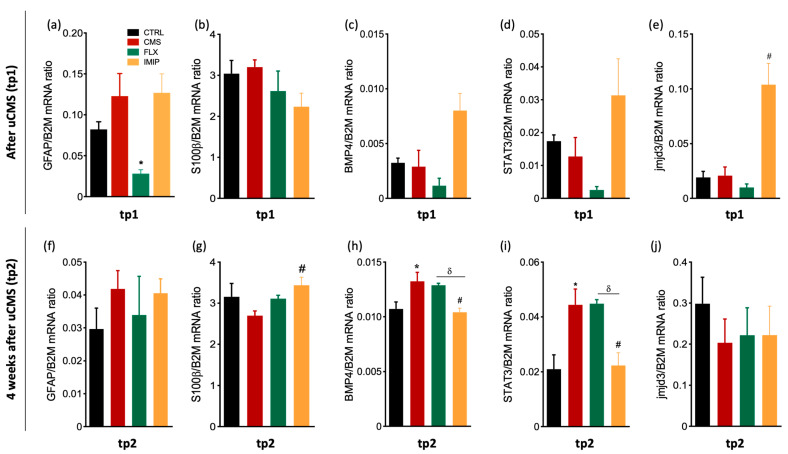
Figure 2.
Relative mRNA expression levels of astrocytic and astrogliogenic related genes at tp1 and tp2 in the macrodissected DG. We analyzed the mRNA expression levels of GFAP (a,f), S100β (b,g), BMP4 (c,h), STAT3 (d,i), and jmjd3 (e,j) in macrodissected dentate gyrus tissue from control animals and uCMS-exposed animals treated either with saline, fluoxetine, or imipramine at tp1 and tp2. * Represents uCMS effect analyzed by Student’s t-test; # Represents ADs effect, by comparison of treatment and SAL animals, analyzed by one-way analysis of variance (ANOVA); and δ represents differences between ADs, analyzed by one-way analysis of variance (ANOVA). Data are represented as mean ± s.e.m. *, #, δ p < 0.05; Sample size: TP1: CTRL: 3–4; CMS: 4–6; FLX: 3–5; IMIP: 3–5; TP2: CTRL: 3–4; CMS: 3–4; FLX: 3–4; and IMIP: 3–4. CTRL, non-stressed animals; IMIP, animals exposed to uCMS and treated with imipramine; FLX, animals exposed to uCMS and treated with fluoxetine; SAL, animals exposed to uCMS and injected with saline; GFAP, Glial Fibrillary Acidic Protein; S100β, S100 calcium-binding protein β; BMP4, Bone morphogenetic protein 4; STAT3, Signal transducer and activator of transcription 3; JMJD3, histone H3 Lys 27 (H3K27) demethylase; tp1, time point 1 (6 weeks; immediately after the stress protocol cessation); and tp2, time point 2 (10 weeks; 4 weeks after the stress protocol cessation).

