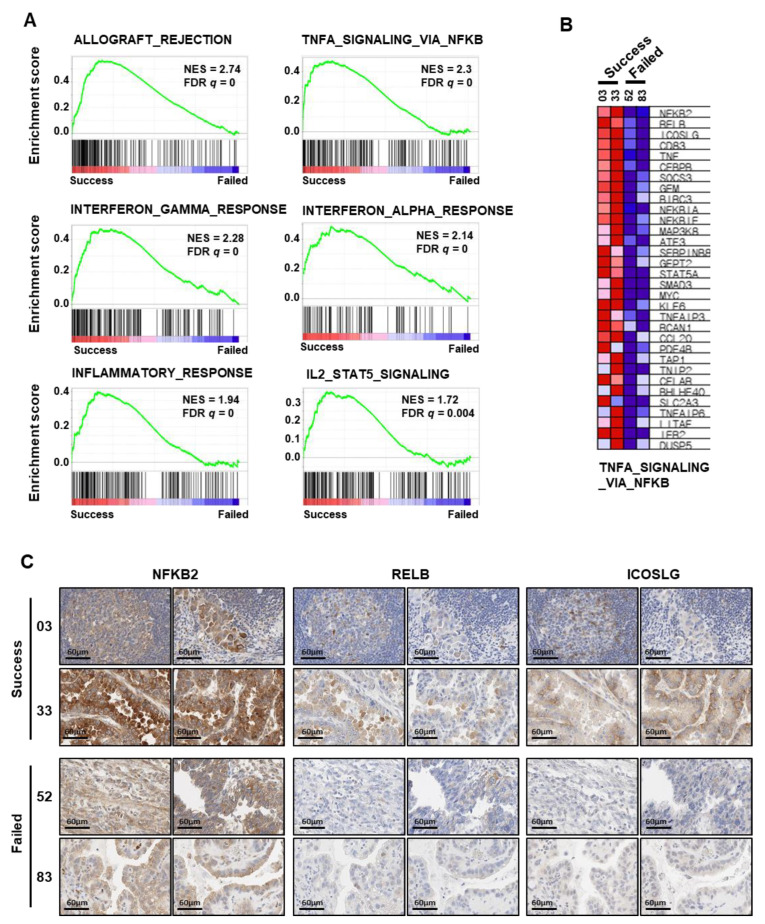
Figure 3.
Analysis of DEGs between successful and failed tumor engraftment in patient tissues. (A) GSEA of RNA-sequencing data for clear cell ovarian cancers with successful engraftment (n = 2) versus failed engraftment (n = 2) from the GSE157153 dataset. (B) Heatmap presents up-regulated DEG lists in TNFA_SIGNALING_VIA_NFKB gene set. (C) Immunohistochemistry of NFKB2, RELB, and ICOSLG in tissues of patients with clear cell ovarian cancer with successful engraftment or failed engraftment. Immunohistochemistry images show two parts of each tissue (×400). DEG: differentially expressed genes; GSEA: gene set enrichment analysis.

