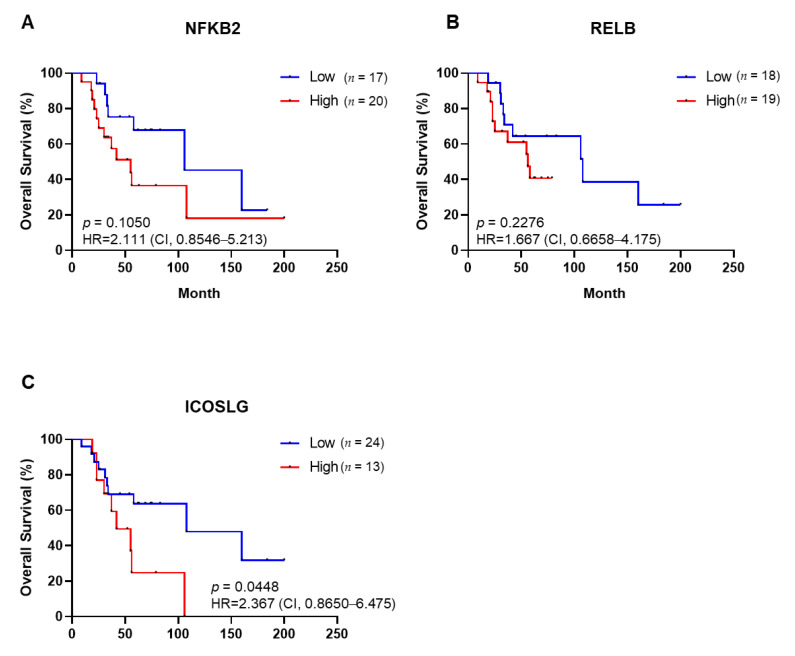
Figure 4.
Overall survival of ovarian clear cell cancer patients based on gene expression levels of NFKB2 (A), RELB (B), and ICOSLG (C), respectively. Kaplan–Meier survival analysis was carried out; log–rank p–values, HR, and CI are shown for each of the results. HR: hazard ratio; CI: confidence interval.

