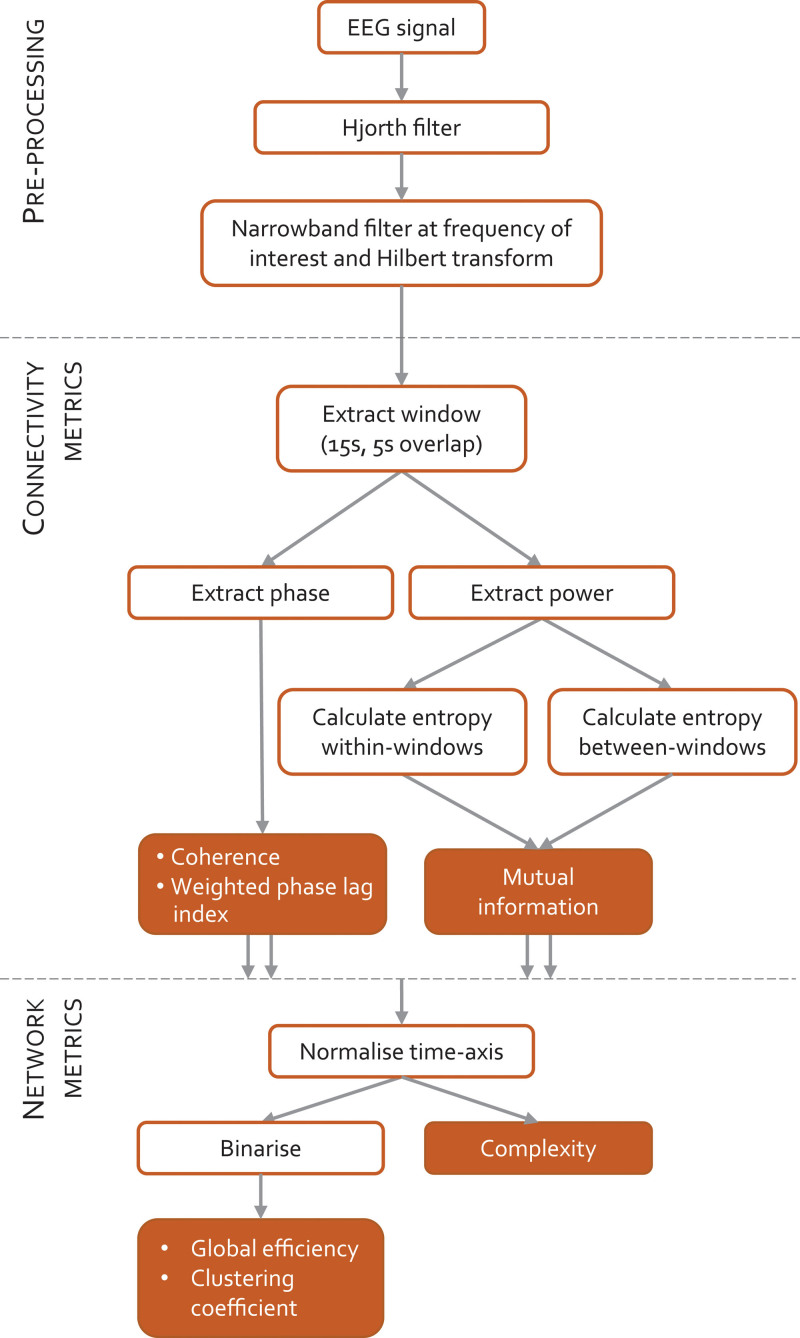
Fig. 1.
Schematic summary of methodology. Electroencephalogram (EEG) signals from volunteers undergoing a slow induction and emergence from propofol anesthesia are filtered and windowed. Phase and power information are extracted from each 15-s window in order to calculate connectivity with three different metrics. The time axis is then normalized between participants, and the network metrics calculated.

