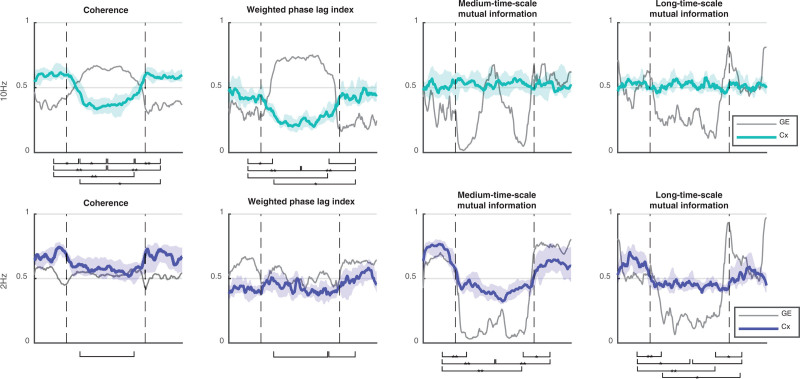
Fig. 5.
Alpha/delta trajectories of the complexity (green and blue) with global efficiency in gray for comparison. Loss of behavioral responsiveness and regain of behavioral responsiveness are indicated by vertical dashed lines. Significant changes in complexity between time points i to v (see Materials and Methods) are indicated with a bracket (P < 0.05), *P < 0.01 and **P < 0.001.

