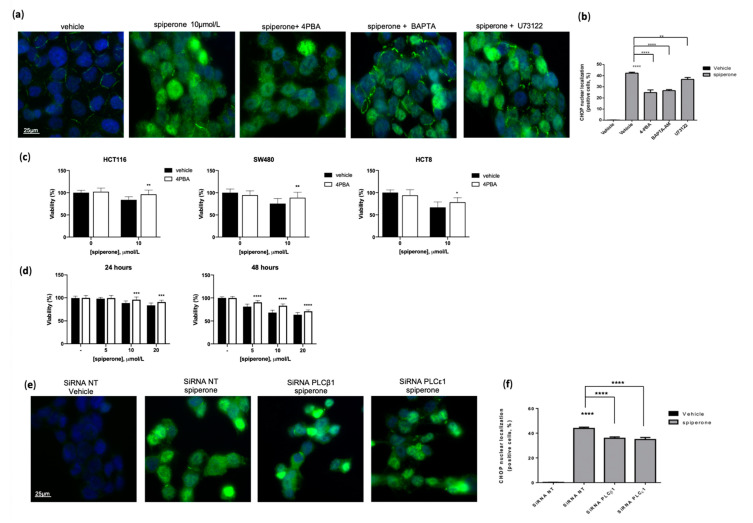
Figure 9.
CHOP nuclear localization is mitigated by BAPTA-AM, U73122, 4-PBA, and PLC β1 and ε1 silencing. HCT116 cells were treated with 10 μmol/L vehicle or spiperone, alone or in combination with 10 μmol/L BAPTA-AM, 1 μmol/L U73122, and 10 μmol/L 4-PBA. CHOP nuclear localization was evaluated by fluorescence microscopy by using anti-CHOP primary antibody (green). Nuclei were stained with DAPI (blue) (a). Histogram showing the ratio of the number of cells presenting CHOP nuclear localization to the total number of cells (b). Data are presented as the mean ± SD of three independent experiments, each performed in triplicate. **: Student’s t-test p < 0.01; ****: Student’s t-test p < 0.0001. Effect of co-treatment with spiperone and the ER stress inhibitor 4PBA at 10 μmol/L. After 30 min of pretreatment, HCT116, SW480, and HCT8 cells were treated with 10 μmol/L vehicle or spiperone for 24 h (c). Graphs displaying cell viability as the percentage of viable cells. Data show the mean ± SD of at least three independent experiments performed in triplicate. *: Student’s t-test p < 0.05; **: Student’s t-test p < 0.01. Effect of CHOP silencing in HCT116 cells; HCT116-silenced cells were treated for 24 and 48 h with 5 μmol/L, 10 μmol/L, and 20 μmol/L spiperone (d). Graphs displaying cell viability as the percentage of viable cells; data show the mean ± SD of at least three independent experiments performed in triplicate. ***: Student’s t-test p < 0.001; ****: Student’s t-test p < 0.0001. Effect of PLC ꞵ1 and PLC 𝜀1 silencing on CHOP nuclear localization. HCT116-silenced cells were treated for 24 h with 10 μmol/L spiperone (e). Graph showing the ratio of the number of cells presenting CHOP nuclear localization to the total number of cells (f); data are presented as the mean ± standard deviation from three independent experiments, each performed in triplicate. ****: Student’s t-test p < 0.0001.

