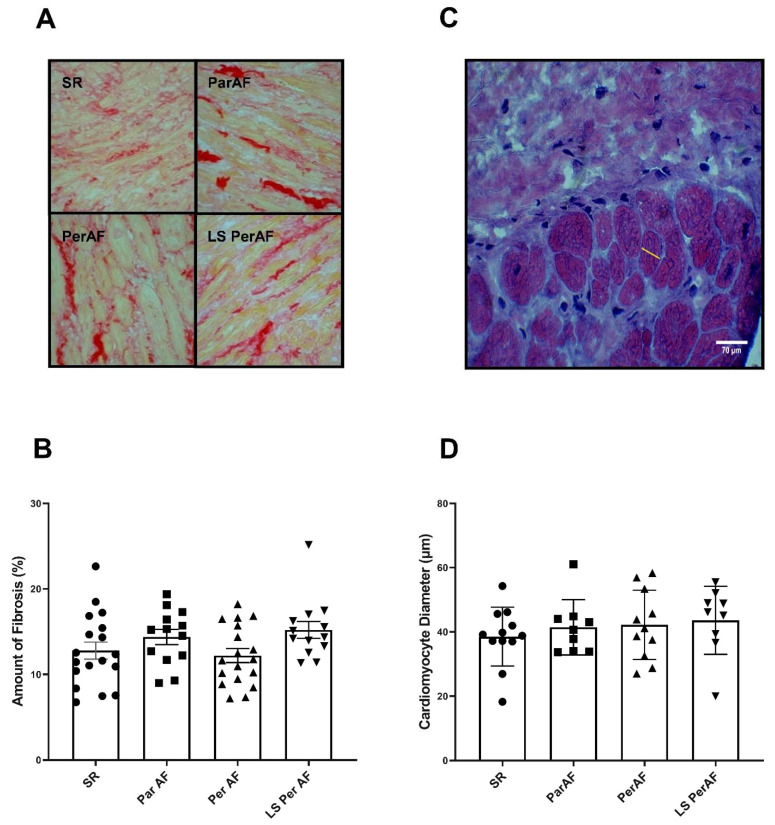
Figure 2.
Picrosirius red and H&E stainings reveal no increase in fibrosis. No significant difference between various stages of AF and the control SR group in terms of the amount of fibrosis (N = 18, SR; N = 13, ParAF; N = 18, PerAF; and N = 13, LS PerAF) (A) and cardiomyocytel diameter (N = 12, SR; N = 9, ParAF; N = 11, PerAF; and N = 9, LS PerAF) (B); respectively, p = 0.12, p = 0.54. Picrosirius red staining in different stages of AF (C). In (D), yellow line shows the measurement of the cardiomyocyte diameter, H&E staining. SR = control group, ParAF = paroxysmal atrial fibrillation, PerAF = persistent atrial fibrillation, LSPerAF = longstanding persistent atrial fibrillation. Statistical tests used: ANOVA.

