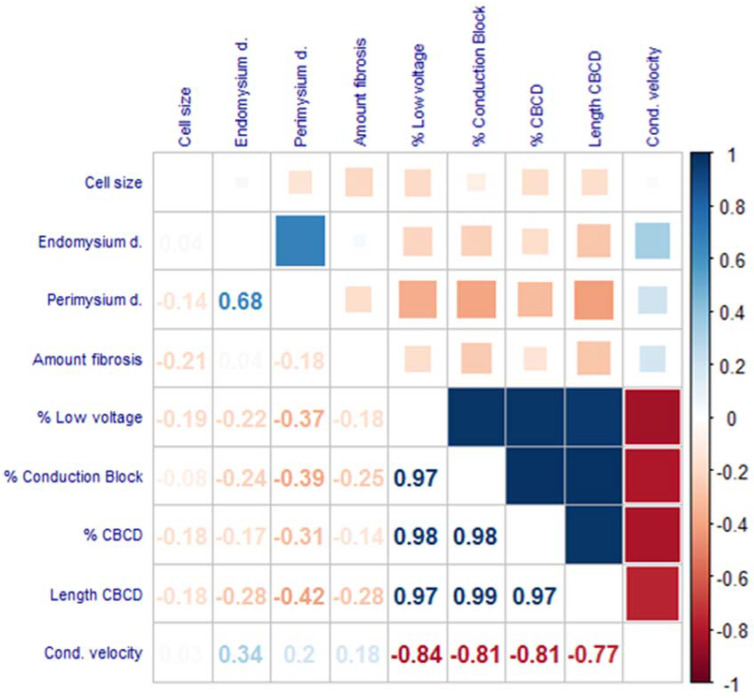
Figure 6.
Correlogram with correlation coefficients for histological fibrosis markers and electrophysiological endpoints. No strong correlation (−0.8 < R < 0.8) was visualized between histological fibrosis markers and electrophysiological endpoints (N = 35). Statistical tests used: Spearman correlation test.

