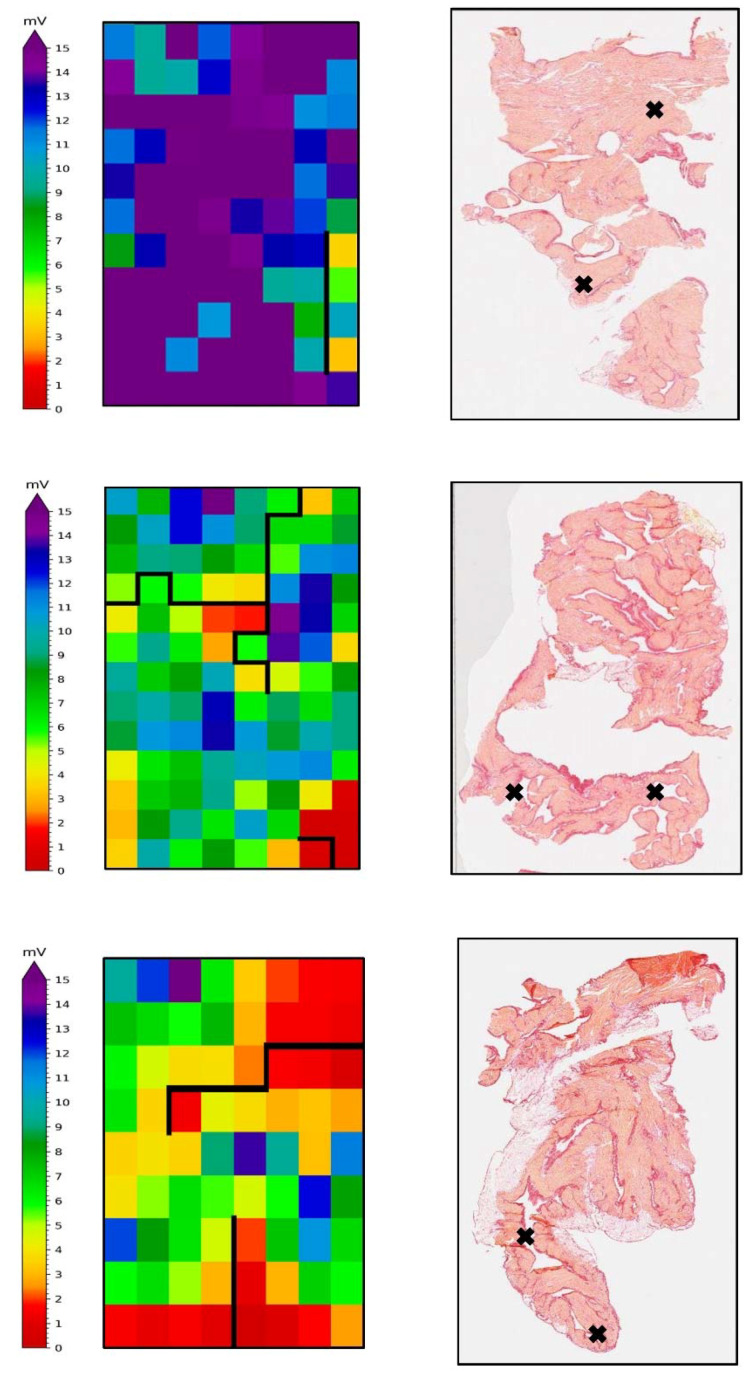
Figure 7.
Spatial analysis of electrophysiological and fibrosis parameters in the LAA of patients with ParAF, PeAF, and LS PerAF. In the left panels, high resolution epicardial mappings reveal simultaneously color-coded degree of voltage, and black lines represent block and delay lines; on the right panels, correspondent LAA tissue was stained with picrosirius and percentage of total fibrosis was determined for each subdivision of the slide. Black crosses indicate sub-sectional areas presenting the highest amount of fibrosis.

