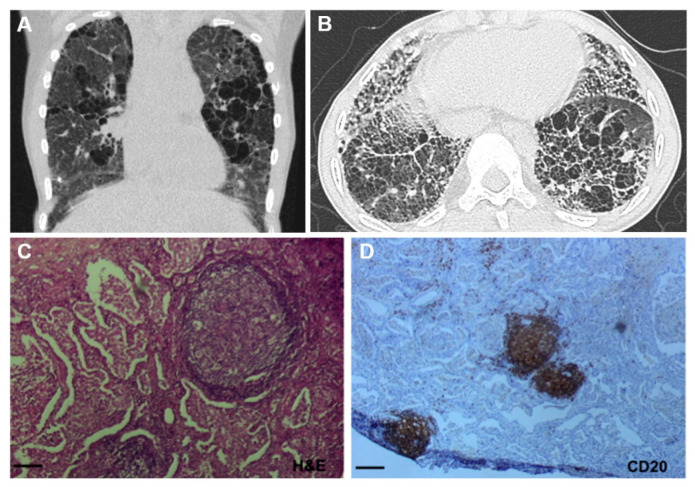
Figure 3.
Representative Lung Imaging and Pathology in SAVI. (A,B) Coronal and axial image of a chest computed tomography (CT) scan from a SAVI patient showing interstitial lung disease with ground glass opacities, cysts, and septal wall thickening. (C,D) Lung tissue section biopsy from a SAVI patient showing lymphoid infiltrate consisting mainly of CD20+ cells. Original magnification: ×40 (C; scale bars, 100 µm), ×10 (D; scale bars, 400 µm) Adapted from Jeremiah et al., J Clin Invest, 2014 and Frémond et al., J Allergy Clin Immunol Pract, 2021.

