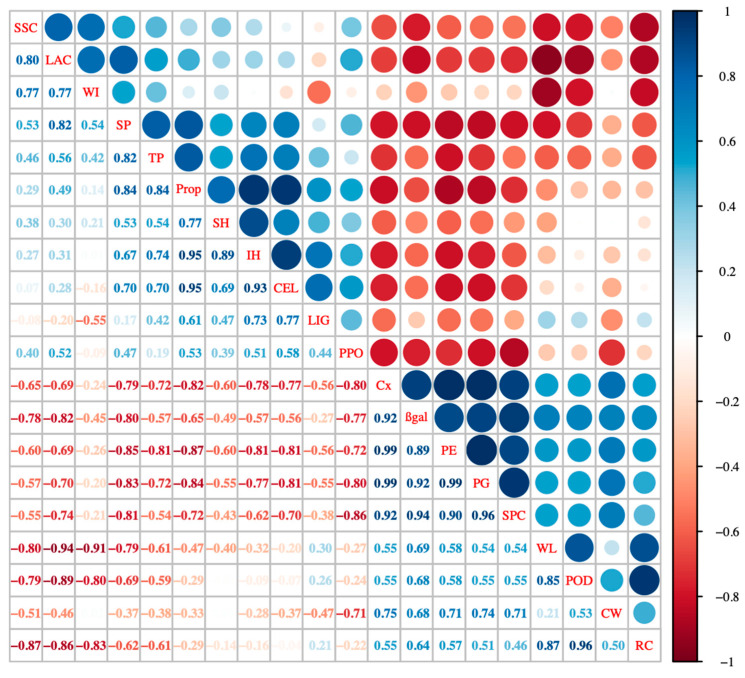
Figure 5.
Pearson’s correlation matrix between texture index, cell wall components and relative enzymes. The correlation coefficients are proportional to the magnitude of the value and the intensity of the color. Blue indicates positive correlation, and negative correlation is shown in red (p < 0.01). (n = 3). RS, reducing sugar content; TTS, soluble solid content; SPC, soluble pectin; SP, soluble protein; PPO, polyphenol oxidase; PROP; protopectin; β-gal, β-half lactosidase; SH, surface hardness; IH, internal hardness; WL, weight loss rate; RC, relative conductivity; POD, peroxidase; LAC, laccase activity; WI, whiteness value; CEL, cellulose content; LIG, lignin content; Cx, cellulase; CW, cell wall content; PME, pectin methyl esterase; PG, polygalacturonase; TP, total polyphenol content.

