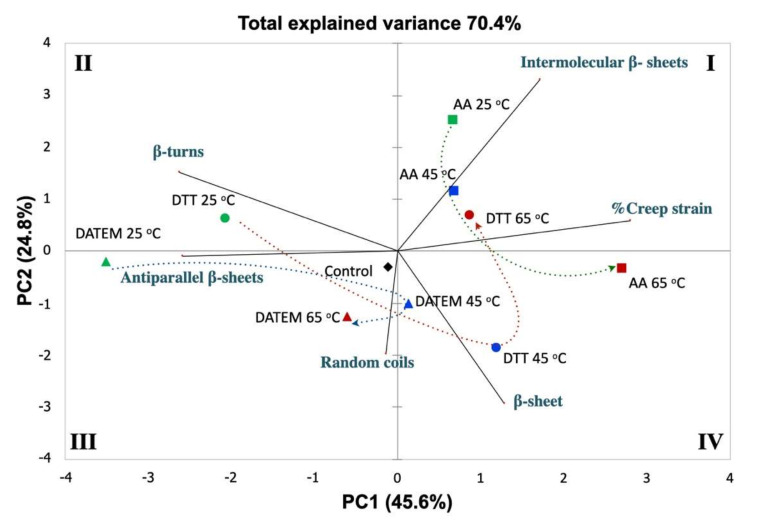
Figure 5.
Principal component analysis of gluten with six indicators of secondary structural motifs and the viscoelastic property (creep strain) showing the effect of temperature (25, 45, and 65 °C) and additive (AA, DATEM, and DTT) treatments. Treatments: 25 °C, green; 45 °C, blue; 65 °C, red; AA, square; DATEM, triangle; and DTT, circle. I-IV are graph quadrants in the Cartesian plane.

