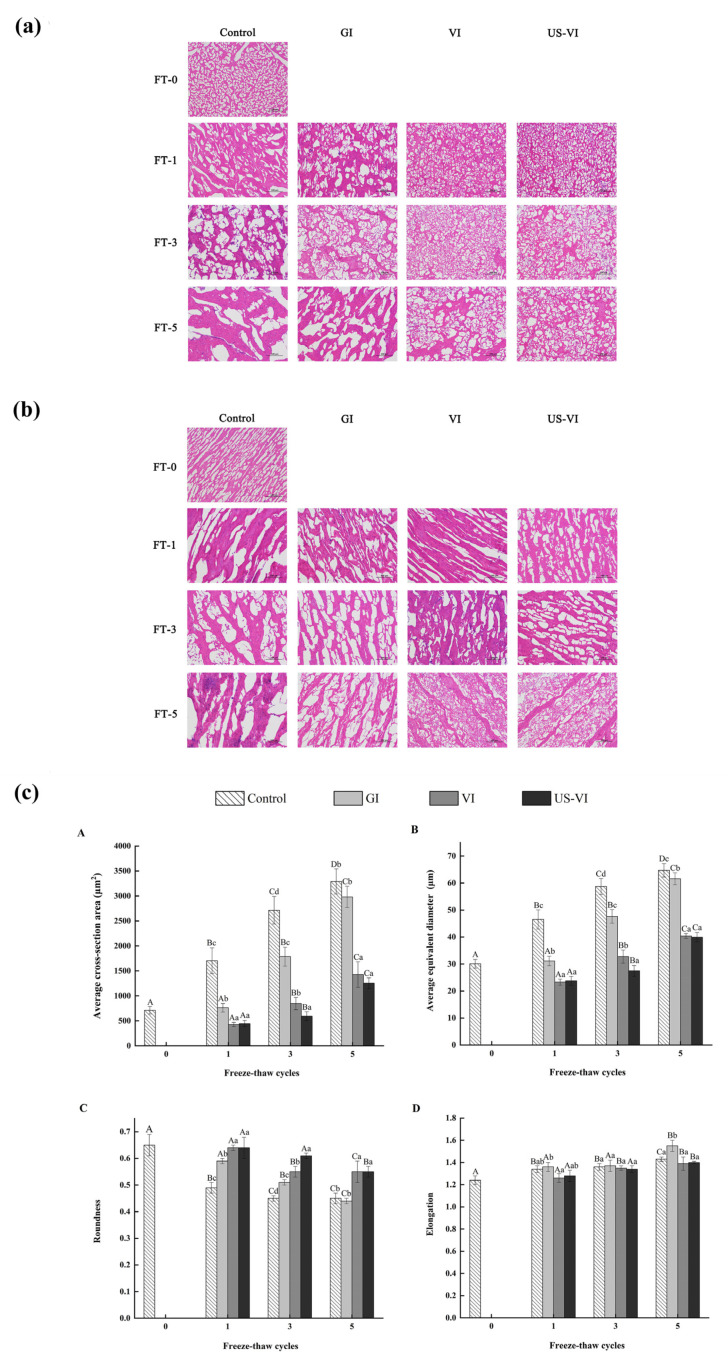
Figure 4.
The observation and analysis of the ice crystal morphology of the scallop adductor muscle induced by freeze–thaw cycles (magnification: 200×). (a) Transverse section; (b) longitudinal section; (c) analysis of the ice crystals morphology ((A) average cross-section area; (B) average equivalent diameter; (C) roundness; (D) elongation). FT-0, 1, 3, and 5: number of freeze–thaw cycles. “A–D” indicated the difference in different number of FTCs (p < 0.05). “a–d” indicated the difference in samples with different pretreatment methods (p < 0.05).

