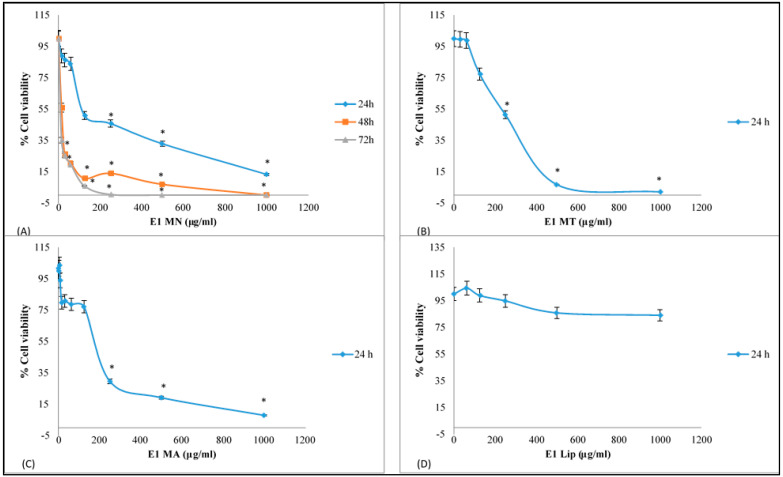
Figure 3.
Dose–effect survival plots for mastic extracts against a human liver cancer HepG2 cell growth. (A) E1 MN: Liposomes contained NMGE, (B) E1 MT: Liposomes contained total mastic gum, (C) E1 MA: Liposomes contained AMGE, and (D) E1 Lip: Empty liposomes. Cell viability was estimated via XTT assay (each point represents mean ± sd of at least six replicate wells). * p < 0.05.

