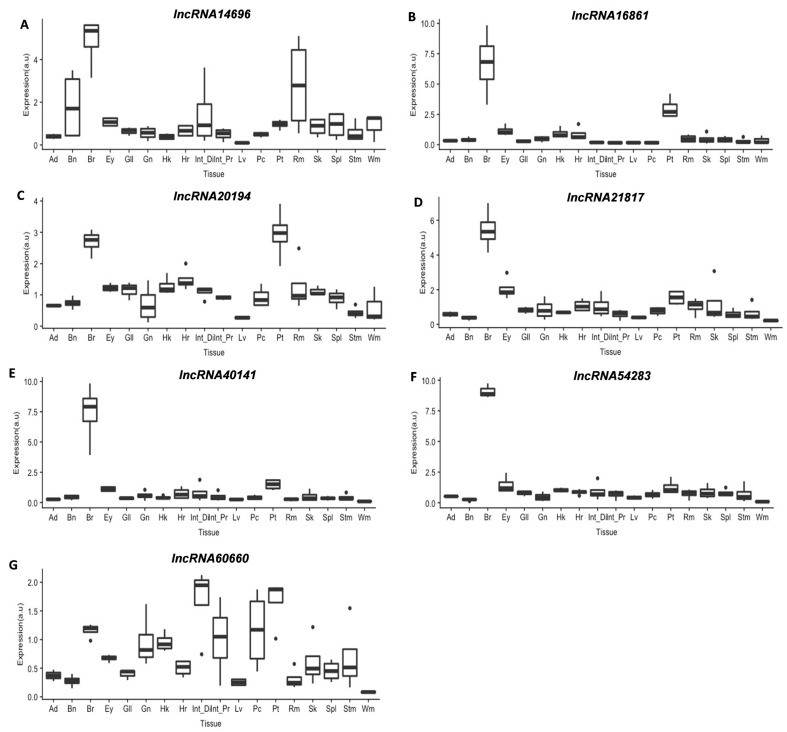
Figure 4.
Boxplots showing lncRNAs expression in different gilthead sea bream tissues (n = 4) (A–G): Ad (Adipose tissue), Bn (Bone), Br (Brain), Ey (Eye), Gl (Gills), Hk (Head kidney), Hr (Heart), Int_Di (Distal Intestine), Int_Pr (Proximal Intestine), Lv (Liver), Pc (Pyloric caeca), Pt (Pituitary), Rm (Slow muscle), Sk (Skin), Spl (Spleen), Stm (Stomach), and Wm (Fast muscle). Gene expression is indicated as arbitrary units (a.u). Outliers are presented as points.

