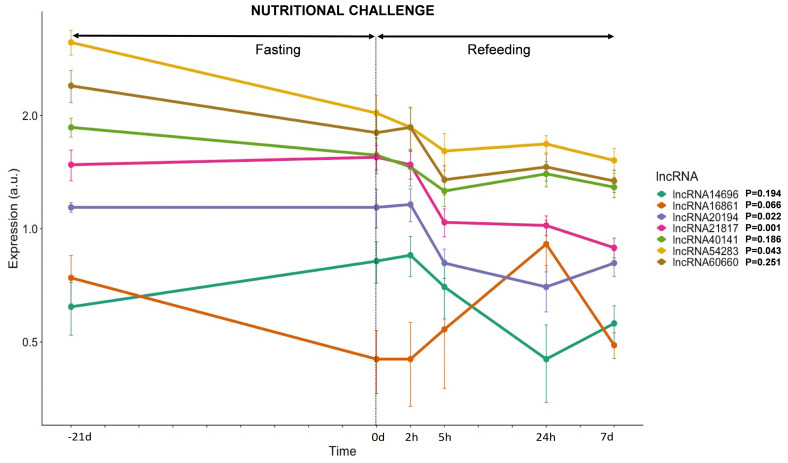
Figure 5.
LncRNAs transcription in response to a nutritional challenge. Plot showing gene expression of 7 lncRNAs in response to 21 days of fasting followed by 7 days of refeeding. Gene expression is expressed as average ± SD (n = 6) of arbitrary units (a.u). The statistical effect of nutrition is indicated for each lncRNA analyzed.

