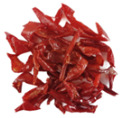
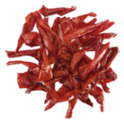
Table 3.
Effect of different drying temperature on color and red pigments.
| Drying Temperature (°C) | Red Pigments (g/kg) | a* | b* | L* |
|---|---|---|---|---|
60 
|
9.47 ± 0.12 b | 41.27 ± 0.05 b | 37.73 ± 0.15 c | 39.17 ± 0.07 c |
70 
|
9.94 ± 0.18 a | 42.92 ± 0.06 a | 42.20 ± 0.07 b | 44.43 ± 0.18 a |
80 
|
9.60 ± 0.06 b | 43.77 ± 0.02 a | 43.62 ± 0.02 a | 42.88 ± 0.09 b |
Notes: different letters in the figure reveal significant differences (p < 0.05) according to the Duncan test.
