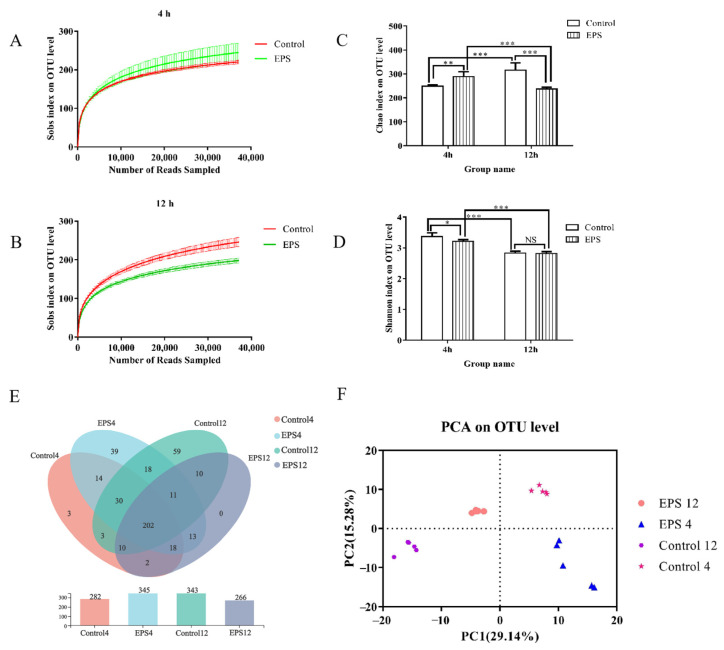
Figure 11.
Analysis of DNA sequence data obtained from in vitro fecal fermentation under the intervention of the EPS produced by Lpb. plantarum NMGL2: Rarefaction curves for each experimental group with an incubation time of 4 h (A) and 12 h (B); α-diversity of fecal microbiota in terms of microbial richness estimates Chao1 (C) and diversity indices Shannon (D) measured at OTUs definition of >97% identity, p values < 0.05, 0.01, 0.001 are indicated by *, **, ***, respectively; Venn diagrams showing the unique and shared OTUs of different treatment samples (E); PCA analysis of fecal microbiota samples (F).

