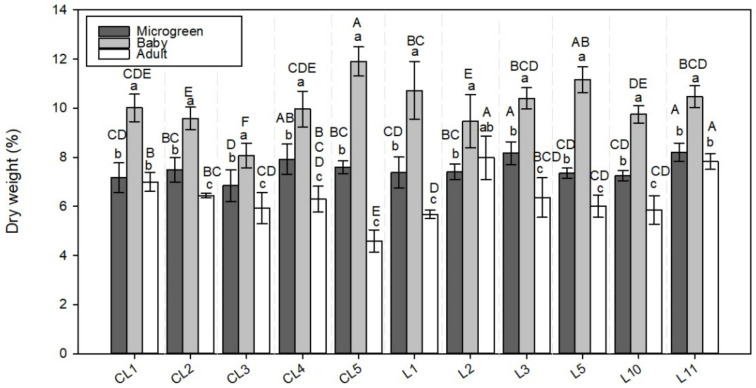
Figure 2.
Dry weight (DW) in the 11 lettuce varieties evaluated in the 3 development stages (microgreen, baby, adult). Values are the mean ± SE of four replicates per landrace. The mean was subjected to a one-way ANOVA. Different capital and lowercase letters indicate significant differences between varieties and development stages, respectively, at p < 0.05 by the LSD test.

