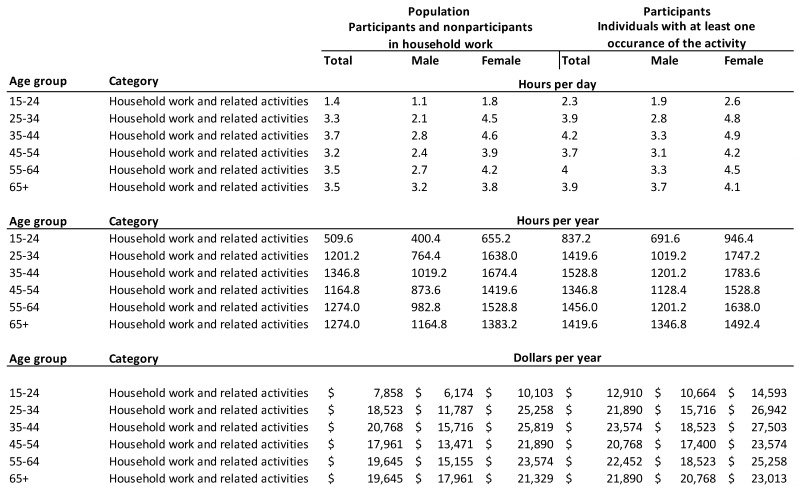
Figure A2.
Data for Household Production Estimates. Source: Statistics Canada. Table 281-0030- Survey of Employment, Payrolls and Hours (SEPH), average hourly earnings for employees paid by the hour, by overtime status and detailed North American Industry Classification System (NAICS), annual (current dollars), calendar year 2011.

