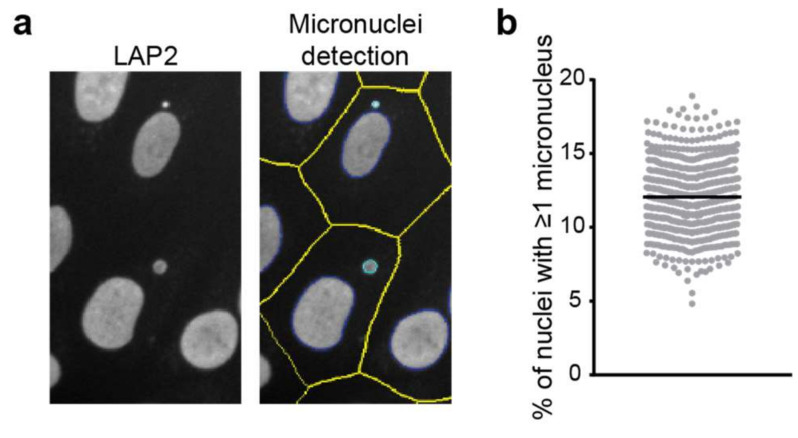
Figure 3.
Detection of micronuclei in LAP2-stained images acquired on a high-content microscope. (a) Example of micronuclei detection in automated microscopy. Defined nuclear contours are indicated in dark blue, micronuclei in cyan and cell boundaries in yellow. See details of the analysis in the main text. (b) Quantitation of micronuclei frequency on images acquired on a high-content microscope in hTERT immortalised control fibroblasts in multiple biological replicates.

