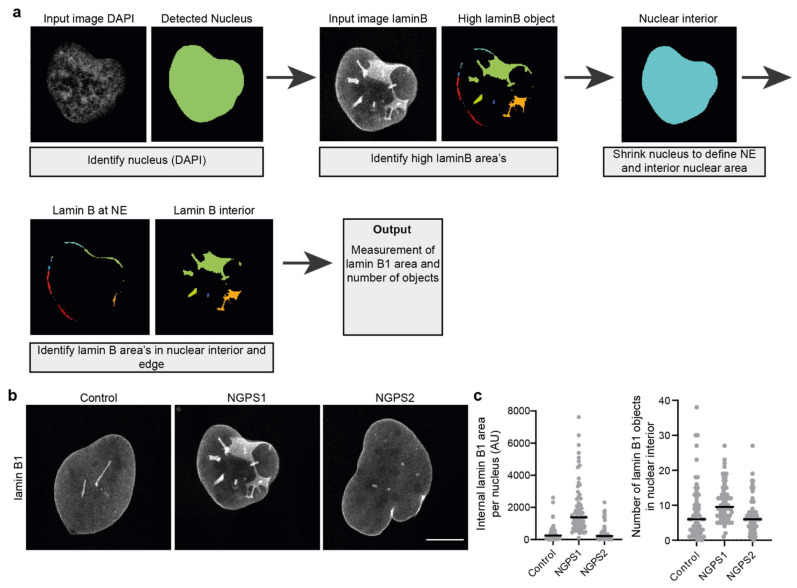
Figure 4.
Quantification of nuclear envelope invaginations. (a) Simplified pipeline and example showing detection of nuclear invaginations in CellProfiler. (b) Representative immunofluorescence images of control and two NGPS patient-derived fibroblast cell lines (NGPS1 = NGPS5796 and NGPS2 = NGPS5787, gift from C. Lopez-Otin) stained for lamin B1. Scale bar 10µm. (c) Examples of intranuclear lamin B1 area quantification and of the number of detected lamin B1 objects in the nuclear interior of cells represented in (b) using the described analysis pipeline.

