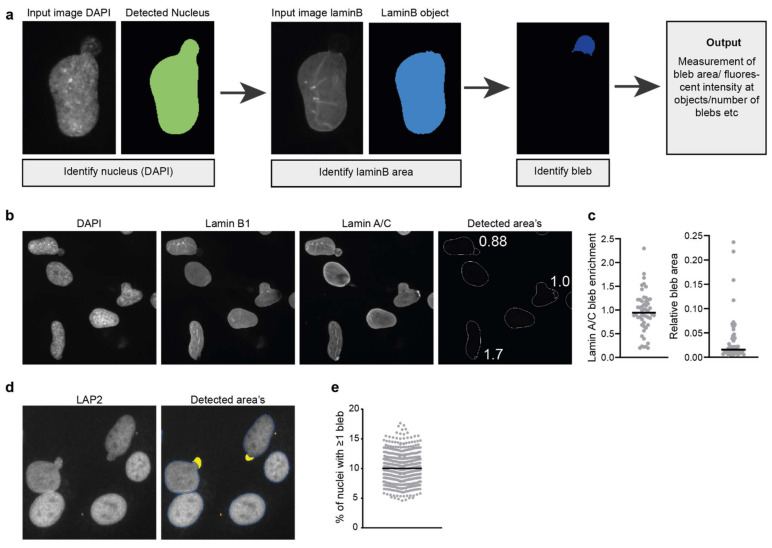
Figure 5.
Detection and analysis of nuclear blebs. (a) Simplified pipeline and example showing the detection of nuclear blebs in CellProfiler. (b) Example image showing the endogenous staining of lamin B1 and lamin A/C in human fibroblast cells and the detected area’s using the pipeline described in (a). Numbers indicate the lamin A/C enrichment calculated for the detected blebs (laminA/Cbleb/laminA/ClaminBobject) (c) Example showing the quantification of lamin A/C enrichment at blebs in human fibroblast and the relative bleb area (areableb/areanucleus) using the described pipeline. (d) Nuclear bleb detection in LAP2-stained nuclei in hTERT immortalised control fibroblasts in images acquired on a high-content microscope. The detection algorithm is based on the micronuclei detection algorithm (see text and Figure 3); however, the algorithm now selects nuclear blebs (yellow overlay) for analysis and rejects micronuclei (orange overlay) based on their size and distance to the primary nucleus (dark blue contour). (e) Quantification of nuclear bleb occurrence frequency in hTERT immortalised control fibroblasts in multiple biological replicates using automated nuclear bleb detection shown in (d).

