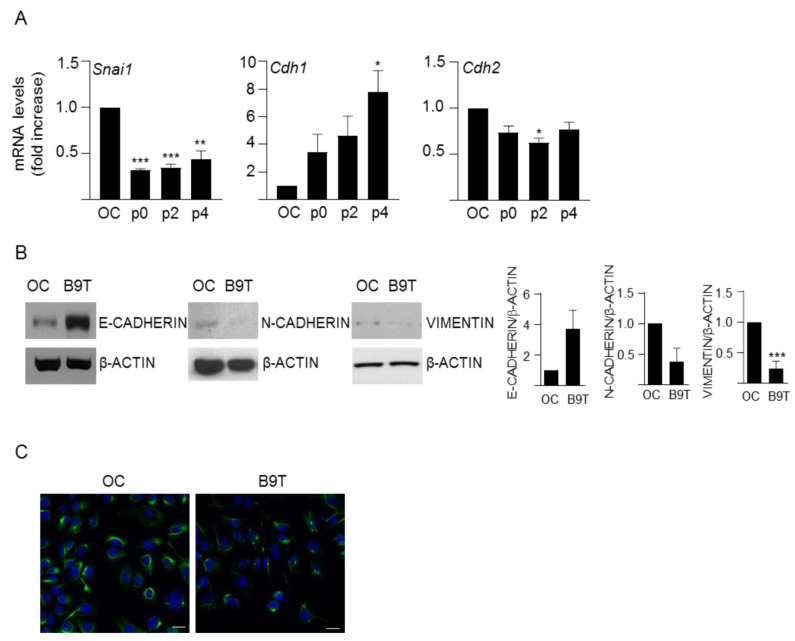
Figure 1.
Analysis of EMT markers in B9T-OC. (A) RT-qPCR analysis for the expression of Snai1, Cdh1 and Cdh2 in oval cells (OC) and B9T-OCs at different passages (passage 0, 2 and 4). Gusb was used for normalization. Data are expressed relative to oval cells (assigned an arbitrary value of 1) and are mean ± SEM of three independent experiments. * p < 0.05, ** p < 0.01 and *** p < 0.001 B9T-OC vs. OC. (B) Western blot analysis of E-CADHERIN, N-CADHERIN and VIMENTIN in oval cells (OC) and established B9T-OCs (B9T). A representative experiment (left panel) and a densitometric analysis (right panel) are shown. Data corresponding to optical density values relative to loading control are mean ± SEM of three independent experiments and are expressed relative to OC samples (assigned an arbitrary value of 1). (C) Oval cells (OC) and B9T-OCs (B9T) were fixed and stained with the VIMENTIN antibody and an Alexa Fluor 488 conjugated secondary antibody. Nuclei were counterstained with DAPI. Representative confocal microscopy images from two to three experiments are shown. Scale bar = 20 μm.

