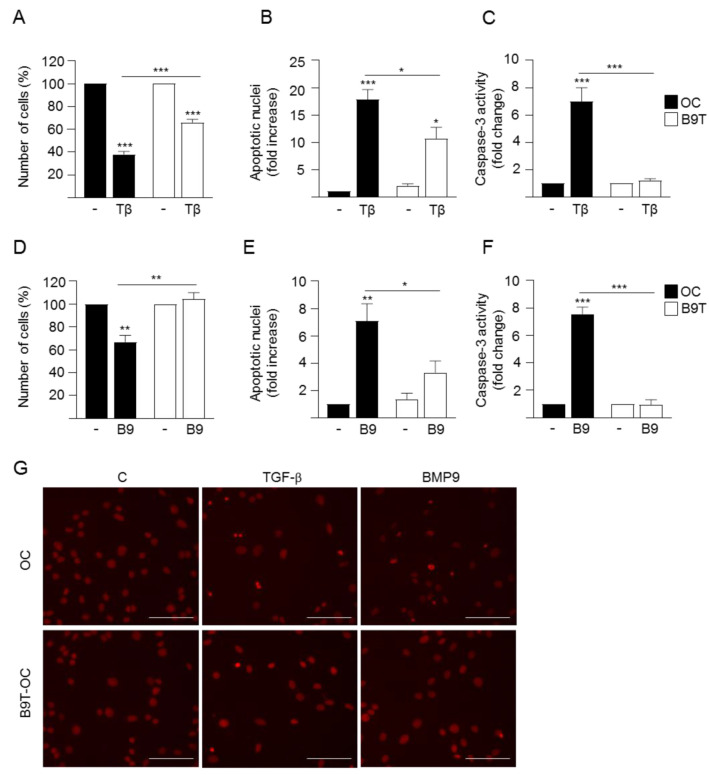
Figure 4.
B9T-OC are more resistant to BMP9 and TGF-β-induced apoptosis than OC. (A–C). Oval cells (OC) and B9T-OC were serum-starved and incubated in the presence of TGF-β (2 ng/mL) for 48 h. (A) Cells were counted. Data from three independent experiments performed in triplicate are shown and expressed as percentage of untreated cells (mean ± SEM). (B) Apoptotic index was calculated by counting apoptotic nuclei after PI staining under a fluorescence microscope. A minimum of 1000 nuclei was counted per condition. Data from four independent experiments performed in triplicate (mean ± SEM) are shown and are expressed relative to untreated OC (assigned an arbitrary value of 1). (C) Caspase-3 activity. Data are mean ± SEM of four experiments and are expressed as a fold change of untreated cells. (D–F) OC and B9T-OC were serum-starved and incubated in the presence of BMP9 (2 ng/mL) for 48 h. (D) Cells were counted. Data from three independent experiments performed in triplicate are shown and expressed as percentage of untreated cells (mean ± SEM) (E). Apoptotic index was calculated as in (B). Data from four independent experiments performed in triplicate (mean ± SEM) are shown and are expressed relative to untreated OC (assigned an arbitrary value of 1). (F) Caspase-3 activity. Data are mean ± SEM of four experiments and are expressed as a fold change of untreated cells. (G) Representative images of propidium iodide staining taken under a fluorescence microscope used for quantification of apoptosis in (B,E). Scale bar = 50 μm. In all cases, data were compared with the untreated condition or as indicated, * p < 0.05, ** p < 0.01 and *** p < 0.001.

