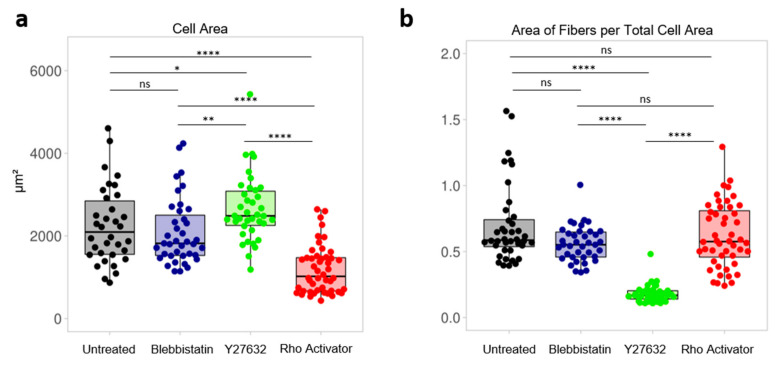
Figure 7.
Focal plane analysis. Each dot represents the median of a single cell. (a) Cell area of untreated and blebbistatin-, Y27632-, Rho activator-treated cells. (b) Area of actin fibers per total cell area of untreated cells and cells treated with blebbistatin, Y27632 and Rho activator. Test: Kruskal-Wallis and post hoc Dunn’s test. ns: p > 0.05, *: p ≤ 0.05, **: p ≤ 0.01, ****: p ≤ 0.0001.

